
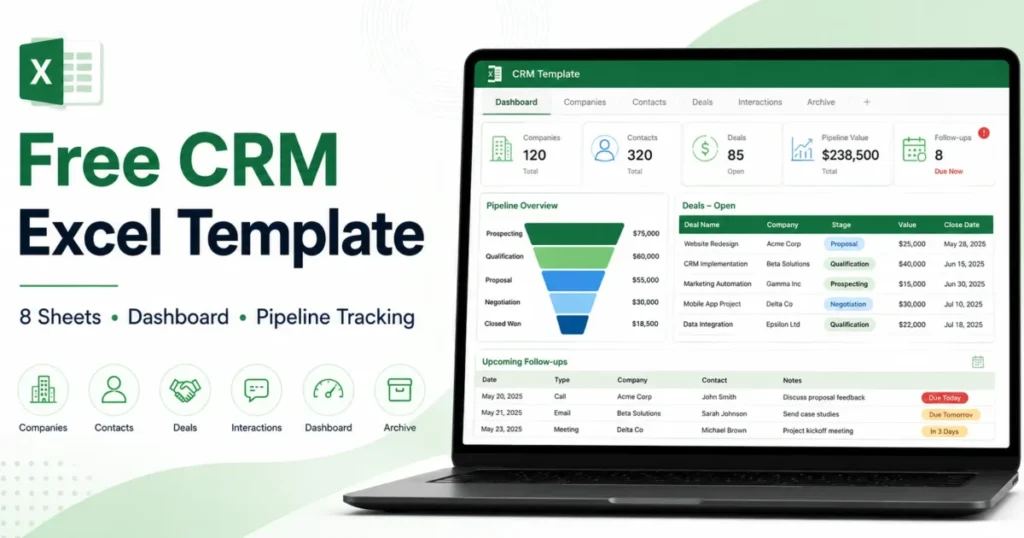
This free CRM Excel template is a 9-sheet .xlsx workbook (version 2.0, updated November 9, 2026) with no macros that tracks companies, contacts, deals and every interaction, linked by permanent IDs. Its formula Dashboard adds a close-month forecast, win rate and 13 data-quality checks, and an Action List orders today’s follow-ups.
It opens in Excel 2016, 2019, 2021, Microsoft 365 and the free Excel for the web, with no email required. Five desktop seats on Microsoft 365 Apps for business ($10.00 per user per month, paid yearly) cost $10.00 x 5 users x 12 months = $600 a year.
It suits solo consultants, founders and two-to-five-person sales teams, not teams that need per-record permissions or automatic email logging. Its formulas cover rows 2 to 500, so each sheet holds 499 records.
Free CRM Excel template 2.0 (.xlsx)
Nine linked sheets with fictional sample rows, a forecast Dashboard and a daily Action List; no macros, no sign-up.
In This Article (9 sections)
What Is a CRM Excel Template?
A CRM Excel template is a workbook that keeps one row per company, contact, deal and interaction, links them by IDs, and gives every open deal a dated next action. It covers the record-keeping part of what a CRM does without the automation.
The workbook never captures email on its own or hides rows from a user; those are two of the four switch signals in the symptom table below.
Which Excel you need to run it
Excel for the web is free with a Microsoft account (free Excel for the web). Lookups use INDEX/MATCH, with no XLOOKUP, FILTER, MAXIFS or dynamic arrays, because XLOOKUP is not available in Excel 2016 and 2019 (Microsoft’s XLOOKUP page).
The template is free; desktop Excel is what a team pays for:
| Setup | Per user per month, paid yearly | Excel apps | 1 user x 12 months | 5 users x 12 months | 10 users x 12 months |
|---|---|---|---|---|---|
| Excel for the web | $0 | Web | $0 | $0 | $0 |
| Business Basic (no Teams) | $5.40 | Web and mobile | $64.80 | $324.00 | $648.00 |
| Apps for business | $10.00 | Desktop and web | $120 | $600 | $1,200 |
| Business Standard with Copilot | $23.50 | Desktop, web, mobile, Teams | $282 | $1,410 | $2,820 |
Sources: Microsoft 365 business plans and pricing and Microsoft’s free Excel for the web page, checked November 2026.
Business Basic adds custom business email, OneDrive and SharePoint to web and mobile Excel; the workbook needs none of them. The cheapest desktop seat is Apps for business; Business Standard with Copilot pays off only for a team that also wants Teams and Copilot.
One person who maintains the Settings sheet in desktop Excel on Apps for business plus four people in Excel for the web pay $10.00 x 1 user x 12 months = $120 a year. A solo seller can buy Microsoft 365 Personal at $99.99 a year.
How to judge any free CRM Excel template
Six checks separate a working CRM template from a contact list, and each prevents a specific failure:
- Permanent record IDs, so a renamed client keeps its deals.
- A separate interaction log, which fills Last Activity Date.
- Dropdowns fed from one Settings list (Microsoft on data validation), so no misspelled stage misses the probability lookup.
- An overdue formula that skips empty dates, so an undated deal is not flagged.
- Only functions your oldest Excel has (no XLOOKUP in Excel 2016 and 2019).
- No macros.
This workbook passes all six; the free Google Sheets CRM templates comparison weighs it against other free files.
What’s Inside the Template: Sheets and Fields
The workbook has 9 sheets, one per record type plus Start Here, Settings, Archive, Dashboard and Action List.
| Sheet | What it holds | ID format | Columns |
|---|---|---|---|
| Start Here | Version, supported Excel, setup order | None | None |
| Settings | Dropdown lists, stage probabilities, targets | None | None |
| Companies | Organizations | COM-0001 | 15 |
| Contacts | People, each linked to a company | CON-0001 | 18 |
| Deals | Opportunities | DEAL-0001 | 23 |
| Interactions | Calls, emails, meetings, tasks, notes | ACT-0001 | 13 |
| Archive | Closed and inactive records | Original ID | 12 |
| Dashboard | Pipeline, forecast, targets, checks, charts | None | None |
| Action List | Open deals by next action date | Deal ID | 10 |
The five data sheets are Excel Tables, so a formula entered in one cell of a column applies to the whole column (Microsoft’s overview of Excel tables). Black text marks a formula; typing over it breaks the sheet.
Deals is the sheet you fill most; the examples below come from its fictional sample row DEAL-0001 unless noted.
| Field | What to enter | Example |
|---|---|---|
| Deal ID | A permanent key | DEAL-0001 |
| Deal Name | A short label | Northstar Analytics CRM Cleanup |
| Company ID | The company’s ID | COM-0001 |
| Company Name | Formula, from Company ID | Northstar Analytics |
| Contact ID | The main contact’s ID | CON-0001 |
| Stage | A stage from Settings | Proposal |
| Probability | Formula, from the stage | 60% |
| Amount | The deal value | $12,000 |
| Weighted Value | Formula, Amount x Probability | $7,200 |
| Opened Date | Date the deal opened | 2026-10-01 |
| Expected Close | Expected close date | 2026-11-28 |
| Last Activity Date | Formula, from Interactions | 2026-11-03 |
| Days Since Activity | Formula, from today’s date | Changes daily |
| Owner | A rep from Settings | Avery Morgan |
| Status | Open, Won, Lost or On hold | Open |
| Next Action | The next step | Send revised scope |
| Next Action Date | When it is due | 2026-11-10 |
| Overdue | Formula, flags a passed date | Changes daily |
| Closed Date | Date a deal was won or lost | 2026-09-25 (DEAL-0006) |
| Loss Reason | A reason from Settings | Lost to competitor (DEAL-0005) |
| Lead Source | Formula, from the contact | Referral |
| Days to Win | Formula, won deals only | 39 (DEAL-0006) |
| Action Rank | Formula, order by next action date | 2 |
Sources: fictional sample data from the workbook, version 2.0.
What’s new in version 2.0
Version 2.0 adds an Action List sheet, fills Last Activity Date from the Interactions log (1.0 had you type it), and turns the Dashboard into a forecast and win-rate report with 13 data checks instead of 9. It also adds:
- Lead Source, Days to Win and Action Rank columns on Deals
- Win rate, average days to win, won deals by month and lead source results
- Monthly targets per owner, with all 10 owner slots shown (1.0 showed 3)
Moving from 1.0, paste your rows into the same-named columns and leave the black formula columns (Last Activity Date included) alone.
How to Use the Template: Set It Up in Eight Steps
Eight steps, in Start Here’s order, take the file from download to a working pipeline:
- Save an untouched master copy and work in a copy.
- Replace the Settings lists and monthly targets.
- Check the stage probabilities.
- Delete the sample rows, then add companies and contacts.
- Import old contacts, back up, then dedupe by email.
- Add deals with a Company ID and a Contact ID.
- Log each call, email or meeting as one Interactions row.
- Give every open deal a next action and date.
Settings (steps 2 and 3). Most dropdowns read their list from Settings; Company Status, Contact Status and Include In Export are typed lists. The stage list is seven fixed rows (Settings C7:C13), so rename a stage before entering deals instead of adding an eighth, which nothing reads. The default probabilities are assumptions, not win rates:
New 10% | Qualified 25% | Discovery 40% | Proposal 60%
Negotiation 80% | Won 100% | Lost 0%
Contacts (steps 4 and 5). Each contact points at a Company ID, the split behind real contact management, and looks up the name:
=IFERROR(INDEX(Companies!$B$2:$B$500,MATCH(E2,Companies!$A$2:$A$500,0)),"ID not found")“ID not found” flags a broken link a blank would hide. Every lookup and Dashboard formula reads rows 2 to 500 only: a company in row 501 shows “ID not found” beside its contacts and drops out of Dashboard totals. Archive closed records before a sheet passes 499. Remove Duplicates permanently deletes data, so copy the range first (Microsoft on removing duplicates), and match on Email alone.
Deals and follow-ups (steps 6 to 8). Probability, weighted value, Lead Source and Days to Win are formulas, and Last Activity Date reads the Interactions log:
Probability:    =IFERROR(INDEX(Settings!$D$7:$D$13,MATCH(F2,Settings!$C$7:$C$13,0)),"")
Weighted value: =IF(OR(H2="",G2=""),"",H2*G2)
Overdue (R2):   =IF(AND(Q2<>"",Q2<TODAY(),O2="Open"),"Overdue","")
A deal is flagged only when a next action date exists, has passed and Status is Open. No formula reads the 5-day default follow-up on Settings, so type each date yourself.
Filled-In Example: One Deal Across Four Sheets
Invented sample data: deal DEAL-0001 filled in correctly.
| Sheet | Row | Linked by | Formulas return |
|---|---|---|---|
| Companies | COM-0001, Northstar Analytics | Company ID | Last activity 2026-11-03 |
| Contacts | CON-0001, Avery Whitfield, source Referral | COM-0001 | Company Name |
| Deals | DEAL-0001, Proposal, $12,000 | COM-0001, CON-0001 | 60%, $7,200 weighted, Referral |
| Interactions | Call 2026-10-01, meeting 2026-10-08, email 2026-11-03 | All three IDs | Last Activity Date |
Sources: fictional sample data from the workbook, version 2.0.
At Proposal’s 60%, the weighted value is $12,000 x 60% = $7,200; set Proposal to 75% on Settings and the row returns $12,000 x 75% = $9,000 with no edit.
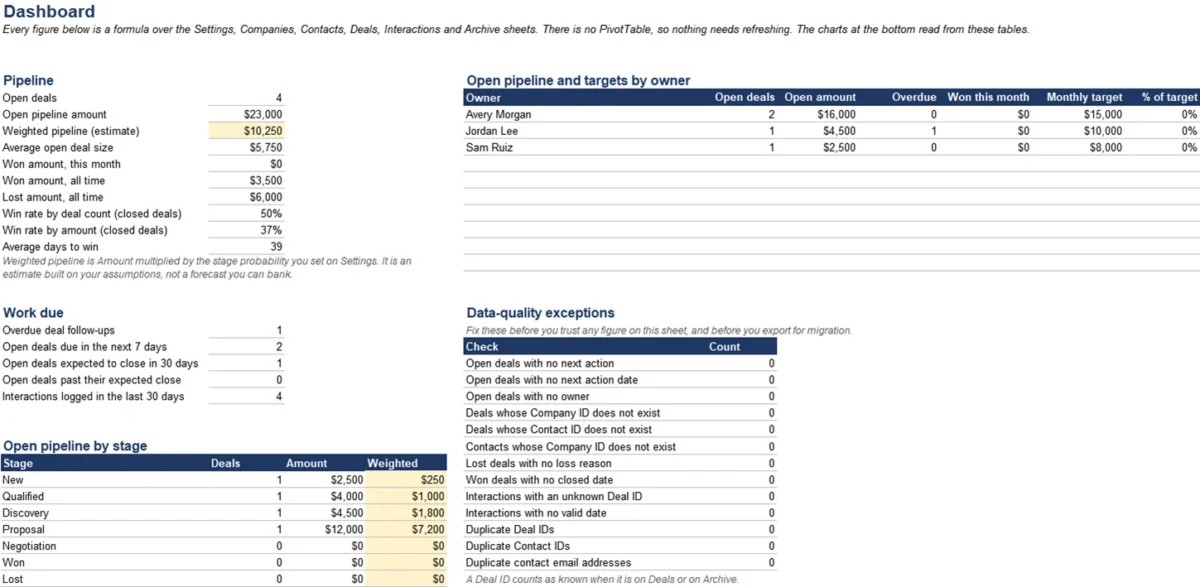
With all six sample deals in place, these Dashboard totals do not depend on today’s date:
| Dashboard figure | Sample value | How it adds up |
|---|---|---|
| Open pipeline amount | $23,000 | $12,000 + $4,000 + $4,500 + $2,500 |
| Weighted pipeline | $10,250 | $7,200 + $1,000 + $1,800 + $250 |
| Average open deal size | $5,750 | $23,000 / 4 open deals |
| Won and lost, all time | $3,500 and $6,000 | DEAL-0006 won, DEAL-0005 lost |
| Win rate by count and amount | 50% and 37% | 1 of 2 closed deals; $3,500 of $9,500 |
| Average days to win | 39 | Opened 2026-08-17, closed 2026-09-25 |
Sources: fictional sample data from the workbook, version 2.0.
Overdue counts, Due labels and the forecast months move with today’s date, so your copy will differ from the screenshots.
CRM Excel Dashboard: Forecast, Win Rate and 13 Data Checks
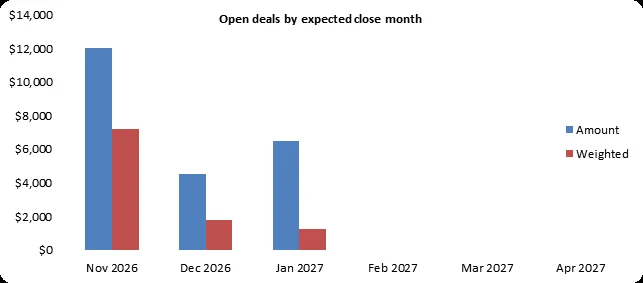
The Dashboard reports ten pipeline figures, owners against monthly targets, five work-due counts, pipeline by stage, a close-month forecast, six months of won deals and lead source results. Every figure is a formula, with no PivotTable to refresh, and 13 exception counts turn red above zero.
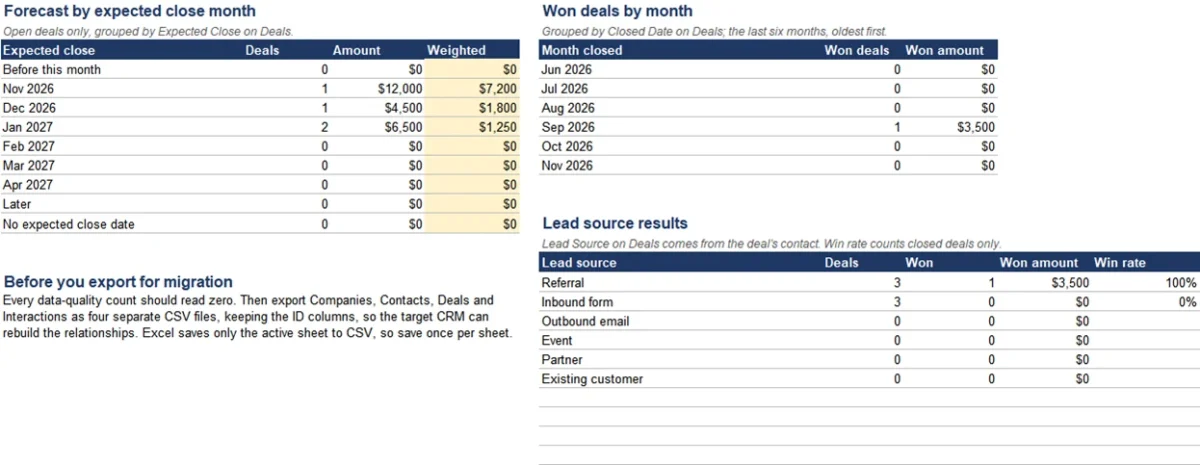
The forecast groups open deals by Expected Close month, and “Open deals past their expected close” flags stale deals. Win rate counts closed deals only; stage-to-stage conversion lives in the sales funnel template.
| Exception checks (13) | A non-zero count means |
|---|---|
| Open deals with no next action, date or owner | Nothing is scheduled, or nobody owns it |
| Unknown Company, Contact or Deal IDs (four checks) | A broken link an export will carry |
| Lost deals with no reason, won deals with no closed date | Gaps in loss and win reporting |
| Interactions with no valid date | Last Activity Date misses that touch |
| Duplicate Deal IDs, Contact IDs or emails | Two rows claim one record |
My take
I would read the exceptions before any total: a deal with no next action date never reaches the Action List, so the pipeline can look clean while its follow-ups are not.
A weekly review in this order:
Weekly 5-minute review
- All 13 data-quality counts read zero
- Overdue follow-ups are done or re-dated
- Deals past their expected close are re-dated or closed
- Each owner’s won this month is read against the target
- Only the Settings owner changed Settings
Daily follow-ups on the Action List
The Action List shows open deals with a next action date, earliest first, each labelled Overdue (red row), Today (yellow row), This week or Later. Its cells are read-only formulas over Deals, so fix rows there; copy row 35 down for more rows. A rep starts each day here instead of filtering Deals.

Customize the Template for Your Business
Three common setups need only Settings changes and new columns at the right edge of a Table.
My take
Pick the one-person setup if you sell alone, because it keeps you in four sheets. The team setup is worth it once a second rep shares deals, since one owner per deal is what stops two reps working the same account.
Simple CRM Excel template for one person
A solo seller can work in Contacts, Deals, Interactions and the Action List alone, with one owner on Settings and the other target slots blank. Point clients without a company at one Companies row, such as “Individual clients”, so lookups resolve instead of showing “ID not found”.
Sales CRM Excel template for a small team
Name every rep in the owner list (the Dashboard shows up to 10), give each open deal one owner, and set each rep’s monthly won-amount target on Settings; the owner table then shows each rep’s month against target. When reps need email capture, the CRM for small business shortlist is the next step.
Real estate CRM Excel template
Rename the open stages (for example Lead, Consultation, Showing, Offer, Under contract), keep Won and Lost last, and add property address, list price and buyer or seller side to Deals; Expected Close and Closed Date already track closings. Add your referral partners and portals to the Settings lead source list, and the Dashboard’s lead source results show which of them produce won deals. For listing feeds or drips, compare real estate CRM software.
Team Collaboration: Share the Workbook Safely
More than one person can edit the workbook at once if it lives on OneDrive, OneDrive for Business or a SharePoint Online library with AutoSave on (Microsoft’s co-authoring guide). Desktop co-authoring needs a Microsoft 365 subscription; Excel for the web co-authors free with a Microsoft account when the file is shared from OneDrive. Because the last saved change generally wins, agree three rules:
- One owner per open deal.
- One person maintains Settings and the targets.
- Nobody moves or deletes columns while others edit.
File > Info > Version History restores an earlier version once everyone stops co-authoring. In Google Sheets, which edits .xlsx files directly, locked and hidden Excel cells become viewable and editable (Google on Office files).
Sheet protection is not data security
Microsoft says worksheet-level protection “is not intended as a security feature” and only stops edits to locked cells (Microsoft on protection and security in Excel). File encryption decides who opens the file; nothing limits which rows a person sees. I would keep payment card and Social Security numbers out of it.
When Excel Stops Working as a CRM
Switch on symptoms, not contact counts. A worksheet holds 1,048,576 rows (Excel specifications and limits), and the limits that decide are structural.
| Symptom | What it tells you | Action |
|---|---|---|
| Overdue count never reaches zero | Follow-up runs on memory | Fix the habit |
| Two reps contact one account | Ownership is not holding | Enforce one owner |
| Formulas get typed over monthly | The structure cannot survive the team | Switch |
| A rep must not see some accounts | You need permissions | Switch |
| You need automatic email capture | Logging by hand is the bottleneck | Switch |
| Nobody trusts the Dashboard | Exception counts stay above zero | Fix the habit |
| Reporting takes an hour a week | Upkeep competes with selling | Switch |
My take
Switching is worth it when any of the four Switch rows applies, because each is a limit of the file itself. Stay when only the habit rows apply: a CRM would inherit the same missing next actions.
Once a structural symptom shows, compare the best CRM software for your team size.
On a tight budget, start with free CRM software plans.
The CRM cost calculator compares CRM plans.
Export your data when you switch
Clear all 13 exception counts, save a backup, then export Companies, Contacts, Deals and Interactions as one CSV file each with every ID column kept. Save As CSV writes only the current worksheet, so repeat it per sheet (Microsoft on exporting CSV files).
Add Archive rows marked Include In Export, since their original IDs keep old interactions connected. Import a small batch first; the CRM migration guide covers the project, and the CRM implementation guide the rollout.
How I Evaluated the Workbook
This page describes version 2.0 from the file: 9 sheets, 5 Excel Tables, 9 named lists and 586 formulas. Excel and Google Sheets behavior comes from their help pages, checked November 2026. Prices are Microsoft’s US prices, paid yearly; its business page publishes no monthly-commitment prices.
FAQ
Can I build my own CRM in Excel for free?
Yes. Start Here lists Excel for the web as supported, and that edition is free with a Microsoft account; the trade-off is that every call and email is typed by hand.
Is Microsoft Excel a CRM tool?
No. Excel is a spreadsheet; it works as a CRM only once a workbook adds linked IDs, an interaction log and dated next actions.
Should I use Excel or Google Sheets for a CRM?
Use the one your team already works in. Google Sheets holds up to 20 million cells per spreadsheet (Google Drive file limits), but protected Excel cells lose their locks there.
Is there an .xls version of the template?
No. The file is .xlsx only, for Excel 2016 or later, with no macros or external links. Excel for the web and Google Sheets both open it.
Should I use XLOOKUP or INDEX/MATCH?
INDEX/MATCH, if anyone opens the file in Excel 2016 or 2019, where XLOOKUP is not available.