
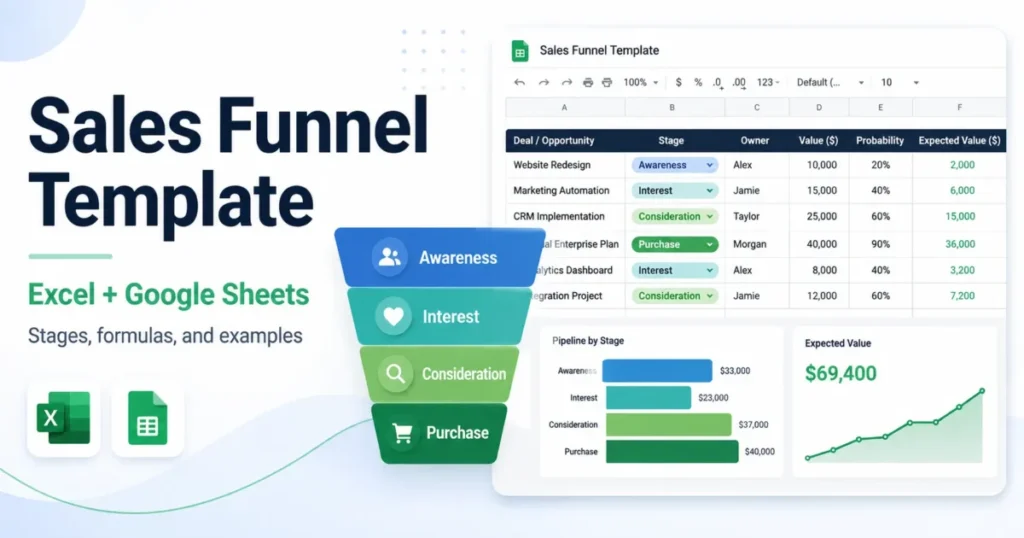
A sales funnel template stops being decoration the first time two reps disagree about what “Qualified” means. Settling that argument is the real job of the spreadsheet, and most downloadable funnels never touch it.
This page carries the whole build. You get a four tab workbook you can recreate in Excel or Google Sheets in a single sitting, a field dictionary, stage entry and exit criteria, conversion formulas that fail safely, and worked examples for B2B, SaaS, service, and ecommerce motions.
It is written for founders, sales managers, revenue operations practitioners, and consultants who need a working tracker before or alongside a CRM. Every asset is copyable from the page, so nothing you need sits behind a form.
One warning up front, because it changes how you read the rest. A spreadsheet that stores only the current stage of each deal describes the present moment accurately, and it cannot reconstruct history you never wrote down.
In This Article (17 sections)
Quick Copy: Sales Funnel Template Build Checklist
Work down this list in order. Each item maps to a section below, and the whole build takes well under an hour once the stage names are settled.
| Build step | Done |
|---|---|
| Pick the stage preset closest to how you sell, then rename every stage in your own words | |
| Write an entry condition and an exit condition for each stage before you enter any data | |
| Create four tabs: Funnel Summary, Lead and Deal Tracker, Lists and Validation, Examples | |
| Put the authoritative Stage, Lead Source, Outcome, and Lost Reason values on the Lists tab | |
| Turn Stage, Lead Source, Outcome, and Lost Reason into dropdowns that reject typed-in variants | |
| Add one header row to the Tracker and keep exactly one open opportunity per row | |
| Give every row a unique, stable identifier you never reuse | |
| Record Stage Entered Date and update it on every real stage change | |
| Require an owner, a next action, and a next action date on every open row | |
| Build stage counts on the Summary tab with a count-by-criterion formula | |
| Wrap every ratio so an empty stage returns blank instead of a division error | |
| Label snapshot ratios as snapshot ratios, not cohort conversion | |
| Add conditional formatting that flags a missing owner, a missing next action, or a past-due date | |
| Require a controlled Lost Reason on any row marked Closed Lost | |
| Agree a weekly review slot, because an unreviewed tracker decays inside a month |
Print it, paste it into a doc, or drop it into the Notes area of your workbook. The checklist works on its own even if you build nothing else here.
Free Sales Funnel Template: The Four Tab Structure
Download the sales funnel template workbook as an .xlsx file with four sheets. No form, no email gate, and it opens in Excel or uploads straight into Google Sheets.
Build it by hand instead if you prefer, or open the file and check every column against the field dictionary further down. Either way the structure below is what you are aiming at.
The workbook splits into four tabs on purpose. Two of them hold data, one holds the rules, and one holds the worked example you check yourself against.
| Tab | What lives here | Who touches it |
|---|---|---|
| Funnel Summary | Stage labels, entry and exit criteria, stage counts, ratios, value totals, review actions | Manager or founder, weekly |
| Lead and Deal Tracker | One row per identifiable lead or opportunity, with owner, stage, dates, and next action | Whoever owns the deal, daily |
| Lists and Validation | The authoritative Stage, Lead Source, Outcome, and Lost Reason values | One named admin, rarely |
| Examples | Filled sample rows and a sample stage summary for reference | Nobody edits, everyone reads |
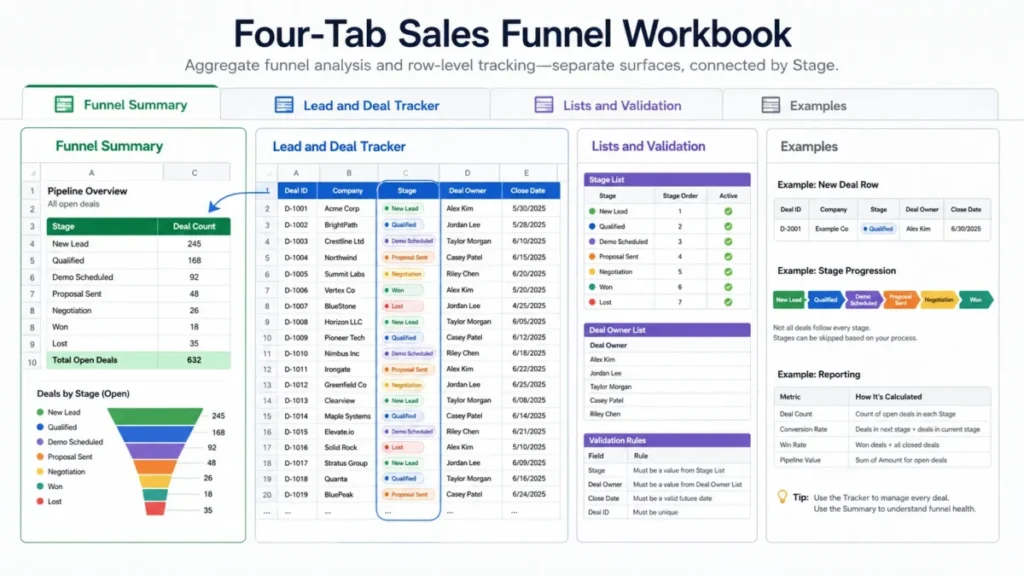
The link between the two data tabs is a single field. The Stage value on a Tracker row is what the Summary tab counts, which is why an unrestricted Stage column quietly destroys every number above it.
Keep the raw Tracker rows clean and boring. Put formatting, notes, and management commentary on the Summary tab so the Tracker stays importable the day you outgrow it.
What the Template Includes
The Tracker carries eighteen fields, seven of which are optional depending on your motion. Nothing in the list exists to look thorough, and every field has a job in either the summary math or the daily work queue.
The Summary tab carries stage labels with their criteria, a current count, and an adjacent-stage count used only where the comparison is honest. It also carries a ratio, a drop-off figure, an optional value total, an optional weighted total, an average age in stage, and a recommended review action.
The Lists tab carries four controlled vocabularies. Editing a value there is the only sanctioned way to change a category, because typing a new one straight into a Tracker row splits your reporting without warning.
The Examples tab carries three filled synthetic rows and a four stage summary. Those numbers exist to show the mechanics and they are not benchmarks for your business.
How to Use This Template
Seven steps, in this order. Skipping straight to data entry is the most common way this build fails.
Name the use case in one sentence first, because the stage names and the required input for every row both follow from it. A consultative B2B motion and a self-serve SaaS motion need the same workbook and different stages.
| Step | Action | Owner | Reject rule |
|---|---|---|---|
| One | Pick a stage preset and rewrite the names in your language | Founder or sales lead | If a stage cannot be described without the word “maybe”, cut it |
| Two | Write entry and exit criteria for every stage | Sales lead | If two people classify the same deal differently, the criteria are not done |
| Three | Fill the Lists tab, then apply dropdown validation | Named admin | If a category can be typed freely, the summary is not trustworthy |
| Four | Add Tracker headers and load real open opportunities | Deal owners | If a row holds two opportunities, split it |
| Five | Maintain Stage, Stage Entered Date, Owner, Next Action, Next Action Date | Deal owners, daily | An open row with no next action is not a tracked deal |
| Six | Build stage counts, then add ratios only where the population matches | Sales lead | If the numerator and denominator cover different groups, publish the counts alone |
| Seven | Review exceptions weekly and close out won and lost rows properly | Manager | A Closed Lost row with no reason teaches you nothing |
Step two is where most teams save or lose the next six months. Criteria written after data entry begins tend to get bent to match whatever people already typed.
Work the steps in sequence and customize as you go. If you would rather see the example output before you build anything, the filled tracker and stage summary further down show what a correctly completed workbook looks like.
The common error to avoid at every step is inventing a category on the fly instead of editing the Lists tab. Each rule in this build rests on documented spreadsheet behaviour, so where a step depends on a product capability the official source is linked in the section that explains it.
Sales Funnel vs Sales Pipeline
These two words get used as synonyms, and the workbook design falls apart when you accept that. Salesforce describes a sales funnel as buyer-centric, charting the buying journey from the prospect’s perspective, while a sales pipeline tracks how reps engage those buyers.
That distinction is exactly why the template has two data tabs instead of one. The Summary tab answers “where is demand leaking”, and the Tracker answers “what does the rep do next”.
| Layer | Question it answers | Unit of analysis | Where it lives |
|---|---|---|---|
| Funnel, buyer view | Where does interest fall away between stages | Groups of buyers at a stage | Funnel Summary tab |
| Pipeline, seller view | What is the state and next action on this deal | One identifiable opportunity | Lead and Deal Tracker tab |
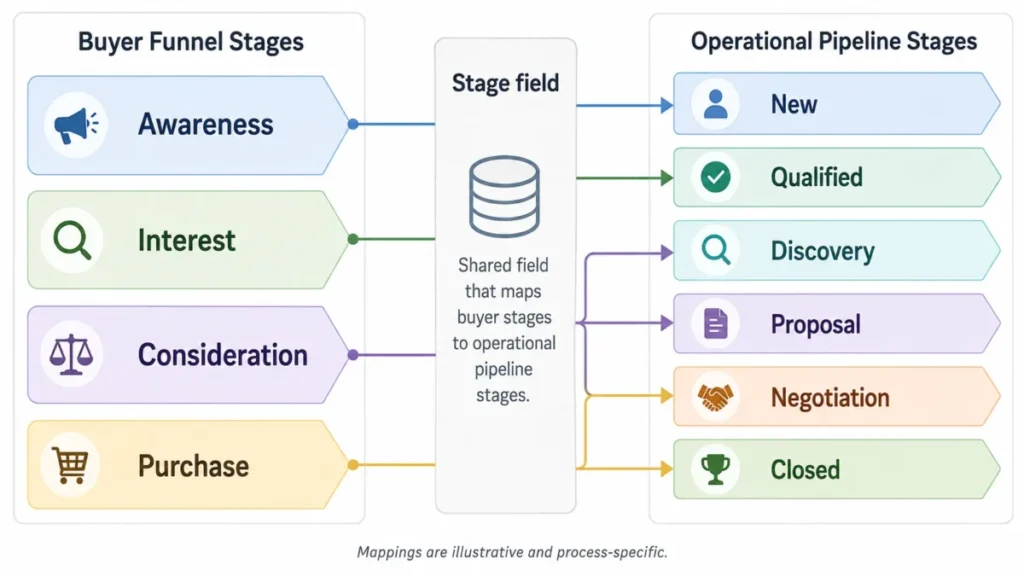
Mapping the two vocabularies is useful for reporting and dangerous if you treat it as equivalence. Use the table below as a translation aid, then edit it to match your own process.
| Buyer funnel stage | Operational pipeline stage examples | What the number is for | Caveat |
|---|---|---|---|
| Awareness | New, Prospecting | Volume of identified demand | Much of it is not yet a real opportunity |
| Interest | Qualified | Quality of top-of-funnel targeting | Qualification rules differ by team, so the ratio is local |
| Consideration | Discovery, Demo, Evaluation | Whether the offer survives scrutiny | Multi-threaded deals can sit here for months |
| Purchase | Proposal, Negotiation, Closed Won | Commercial conversion | Closed Lost rows belong in the same window |
Salesforce also describes the pipeline as a visual representation of where each prospect sits in the sales process, and it ties stage movement to defined exit criteria rather than to a rep’s judgement. It does not publish those criteria for you, which is precisely the work the next section asks you to do.
How to Customize the Stages
Stage names are not the deliverable. The deliverable is a pair of observable conditions per stage that two different people would apply the same way.
Pipedrive’s guidance is blunt about this, and it is worth copying.
“Each stage in the pipeline view represents a step your deals go through before they’re won or lost.” That framing comes straight from Pipedrive’s pipeline stage documentation.
Stage names should mirror the way your team sells in practice, not the way a template author imagined it. Fewer, clearer stages beat a long ladder nobody maintains.
Start from the preset closest to your motion, then rewrite it. Treat every preset below as a draft, never as a standard.
| Stage | Entry criterion, observable | Exit criterion, observable |
|---|---|---|
| New or Prospecting | A named contact and a company exist in the row | A qualification conversation has been held or booked |
| Qualified | Need, rough budget range, and a decision path are documented in Notes | A discovery session or demo is scheduled |
| Discovery or Demo | The session happened and the requirement is written down | The buyer asks for pricing, scope, or a proposal |
| Proposal | A written offer has been sent, with a date | The buyer responds with terms, objections, or a decision |
| Negotiation | Terms are being discussed in writing | Signature, verbal commitment, or a documented loss |
| Closed Won or Closed Lost | A final decision exists | Row is archived after the loss or handover review |
Source: Salesforce official documentation on sales pipeline stages and exit criteria, checked 2026-08-07.
B2B Consultative Sales
Use the six stage set above almost as written. Consultative deals earn their length in Discovery, so that is the stage where an aging flag pays for itself.
Add a Decision Maker field if more than two people sign off. Without it, the Qualified exit criterion collapses into wishful thinking.
SaaS Sales
Split evaluation away from the demo. A stage set of Lead, Qualified, Demo or Trial, Evaluation, Proposal, then Closed reflects how self-serve trials behave.
Trial activity is the honest entry criterion for Evaluation, not the trial signup itself. A signup with no product usage belongs back in Qualified.
Service Businesses
Shorten it. Inquiry, Qualified, Consultation, Proposal, then Signed or Lost covers most agency, consulting, and trades workflows without inventing bureaucracy.
Scope creep is the failure mode here, so put the agreed deliverable in Notes at the Proposal stage. That single habit turns Closed Lost reasons into something you can act on.
Ecommerce and Aggregate Reporting
Use Awareness, Interest, Consideration, Purchase on the Summary tab only. Anonymous site visits do not belong in a row-per-opportunity tracker, and forcing them there produces a bloated sheet that answers nothing.
Keep the Tracker for identifiable leads such as wholesale enquiries, high-value carts you follow up by hand, or B2B accounts. Send visit-to-cart-to-checkout measurement to an analytics tool built for event data.
Field Dictionary
Eighteen fields, with the rule attached to each one. Required-when-open means the field is mandatory for any row whose Outcome is still Open.
| Field | Purpose | Required | Type | Allowed values | Example |
|---|---|---|---|---|---|
| Lead ID | Stable identifier for dedupe and later import | Yes | Text | Unique, never reused | SF-001 |
| Created Date | When the record entered the workbook | Yes | Date | Valid date | 2026-08-03 |
| Account or Lead Name | Human-readable label | Yes | Text | Non-blank | Redwood Analytics |
| Contact Name | Primary human contact | No | Text | Free text | A. Rivera |
| Contact address where the workflow needs it | No | Text | Free text | Collect only what you will use | |
| Lead Source | Descriptive grouping for reporting | Yes | Dropdown | Lists tab only | Organic Search |
| Funnel Stage | Current operational stage | Yes | Dropdown | Lists tab only | Qualified |
| Stage Entered Date | Start of the current stage | Yes | Date | Valid date, updated on change | 2026-08-05 |
| Deal Value | Opportunity value where an amount is meaningful | No | Number | Zero or greater | 6,000 |
| Close Probability | Team-defined planning assumption | No | Decimal | Between zero and one | 0.30 |
| Expected Close Date | Planning date for open rows | No | Date | Valid date or blank | 2026-08-28 |
| Owner | Person responsible for the next move | Required when open | Text or dropdown | Non-blank while open | Sales Rep A |
| Last Contact Date | Most recent meaningful contact | No | Date | Valid date or blank | 2026-08-06 |
| Next Action | The concrete next seller move | Required when open | Text | Non-blank while open | Schedule discovery call |
| Next Action Date | When that move is due | Required when open | Date | Valid date while open | 2026-08-10 |
| Outcome | Separates live work from finished work | Required when closed | Dropdown | Open, Closed Won, Closed Lost | Open |
| Lost Reason | Normalized reason a deal died | Required when Closed Lost | Dropdown | Lists tab only | Budget |
| Notes | Context that has no structured home | No | Text | Free text | Two stakeholders, legal review pending |
Two fields carry more weight than their size suggests. Lead ID is what makes a later import survive contact with a CRM, and Stage Entered Date is the only reason your sheet can tell you anything about deal age.
Lead Source deserves one caution. A hand-typed source field supports descriptive grouping, and it is not an attribution model, so read source-level ratios as a prompt to investigate rather than as proof of what caused the revenue.
Source: Microsoft official documentation for Excel data validation rules and Google official documentation for Sheets dropdowns, checked 2026-08-07.
Lists and Validation Rules
Free text categories are the quietest way to break a funnel report. “Qualified”, “qualified”, and “Qual” become three separate groups in any exact-match count, and the totals still look plausible.
Both spreadsheet platforms solve this the same way. Google documents that an entry that does not match an item on the list is rejected by default, with an advanced option to show a warning instead.
Excel behaves comparably through Data Validation, which restricts the type of data or the values that users enter into a cell. Choosing the Stop error alert style blocks values outside your defined list, while the Information and Warning styles let the entry through with a prompt.
Put these four vocabularies on the Lists tab and treat that tab as the only place they change.
| List | Starting values | Edit rule |
|---|---|---|
| Stage | Your six or fewer operational stages | Renaming a stage means updating the Summary labels in the same sitting |
| Lead Source | Organic Search, Paid, Referral, Partner, Outbound, Event, Other | Keep “Other” small, and split it once it passes a tenth of your rows |
| Outcome | Open, Closed Won, Closed Lost | Never add a fourth value, since half the logic depends on three |
| Lost Reason | Budget, Timing, No Decision, Lost to Competitor, Poor Fit, Unresponsive | Six to eight values maximum, or nobody picks honestly |
Validation settings, field by field:
| Field | Rule type | Behaviour on bad input |
|---|---|---|
| Funnel Stage, Lead Source, Outcome, Lost Reason | List from the Lists tab range | Reject the entry |
| Created Date, Stage Entered Date, Next Action Date | Date | Reject the entry |
| Deal Value | Decimal, zero or greater | Reject the entry |
| Close Probability | Decimal between zero and one | Reject the entry |
| Lead ID | Custom formula counting itself in the ID column | Reject a duplicate |
Exception flags belong here too. Google Sheets supports conditional formatting driven by a custom formula, including rules that format an entire row from the value of another cell.
That is the mechanism behind every exception flag in this build, from a blank owner to a past-due next action.
Three rules cover most of the value. Flag an open row with no owner, flag an open row with no next action, and flag an open row whose next action date has passed.
Formulas and Metrics
Six formulas run the whole summary. All of them are copyable, and all of them are written to fail quietly rather than to spray errors across a mostly empty sheet.
| Metric | What it answers | Denominator you must be able to name |
|---|---|---|
| Stage count | How many current rows sit in this stage | None, it is a raw count |
| Stage-to-next ratio | What share of this group appears in the next stage | The same population, in the same window |
| Drop-off count | How many rows are absent from the next stage | Same as above |
| Drop-off rate | The complement of the stage-to-next ratio | Same as above |
| Weighted value | An assumption-based planning total | Your own historical close data |
| Days in stage | How long this row has sat where it is | Current state only, not stage history |
Counting is the easy part. Microsoft documents the syntax as COUNTIF(range, criteria), which counts cells meeting a specified condition, and that is all a stage count needs.
The formulas below assume the column order used in the field dictionary above. Adjust the references if your layout differs.
| Tab | Column | Field |
|---|---|---|
| Funnel Summary | A | Stage label |
| Funnel Summary | D | Current count |
| Funnel Summary | E | Next stage count |
| Lead and Deal Tracker | G | Funnel Stage |
| Lead and Deal Tracker | H | Stage Entered Date |
| Lead and Deal Tracker | I | Deal Value |
| Lead and Deal Tracker | J | Close Probability |
Stage count
=COUNTIF(Tracker!$G:$G, $A2)

Stage-to-next ratio
=IF($D2=0, "", $E2/$D2)

Drop-off count
=$D2-$E2

Drop-off rate
=IF($D2=0, "", 1-($E2/$D2))

Weighted value
=SUMPRODUCT((TrackerStage=$A2)*TrackerValue*TrackerProbability)

Days in current stage
=IF(Tracker!H2="", "", TODAY()-Tracker!H2)
The weighted-value formula uses three named ranges over the Tracker columns: TrackerStage, TrackerValue, and TrackerProbability. Naming them once keeps the formula readable and survives a column insert.
The zero guard matters more than it looks. Microsoft describes IF as returning one value when a condition is true and another when it is false, so wrapping the ratio returns a blank rather than a division error when a stage is empty.
Now the part that separates a useful funnel from a misleading one. Counting how many deals sit in Qualified this morning and how many sit in Proposal, then dividing, does not measure progression.
Those two groups are different populations captured at one moment. Call that a snapshot ratio and use it to spot obvious imbalance, and do not present it as a conversion rate.
A real cohort conversion needs a defined group that entered one stage inside a stated window, followed forward to see how many reached the next stage. The base template cannot produce that, because it stores one Stage Entered Date and overwrites it on every move.
If you need cohort math, add a Stage History tab that logs one row per transition with Lead ID, from-stage, to-stage, and date. That is a real upgrade, and it is also the point where most teams decide a CRM is cheaper than the discipline.
Weighted value carries its own health warning. Deal Value multiplied by Close Probability is planning arithmetic, not a forecast, because the probability is a number your team chose.
Leave Close Probability blank until you have enough closed rows to calibrate it from your own history. Borrowing stage probabilities from an article, including this one, manufactures false precision.
For a stage chart, Excel can build one natively. Microsoft documents that funnel charts show values across multiple stages in a process, built from a column of stage names and a column of values on supported versions.
Sales Funnel Examples
Every figure below is synthetic. The rows exist to show how the fields interact, and none of the numbers describes any real business.
Three filled Tracker rows, one open early, one open late, one closed lost:
| Lead ID | Created | Account | Source | Stage | Stage entered | Value (USD) | Prob. | Owner | Next action | Due | Outcome | Lost reason |
|---|---|---|---|---|---|---|---|---|---|---|---|---|
| SF-001 | 2026-08-03 | Redwood Analytics | Organic Search | Qualified | 2026-08-05 | 6,000 | 0.30 | Sales Rep A | Schedule discovery call | 2026-08-10 | Open | |
| SF-002 | 2026-08-01 | Harbor Services | Referral | Proposal | 2026-08-06 | 12,000 | 0.60 | Sales Rep B | Review proposal questions | 2026-08-09 | Open | |
| SF-003 | 2026-07-20 | BrightCart Studio | Partner | Closed Lost | 2026-08-04 | 4,500 | 0 | Sales Rep A | Archive after loss review | 2026-08-07 | Closed Lost | Budget |
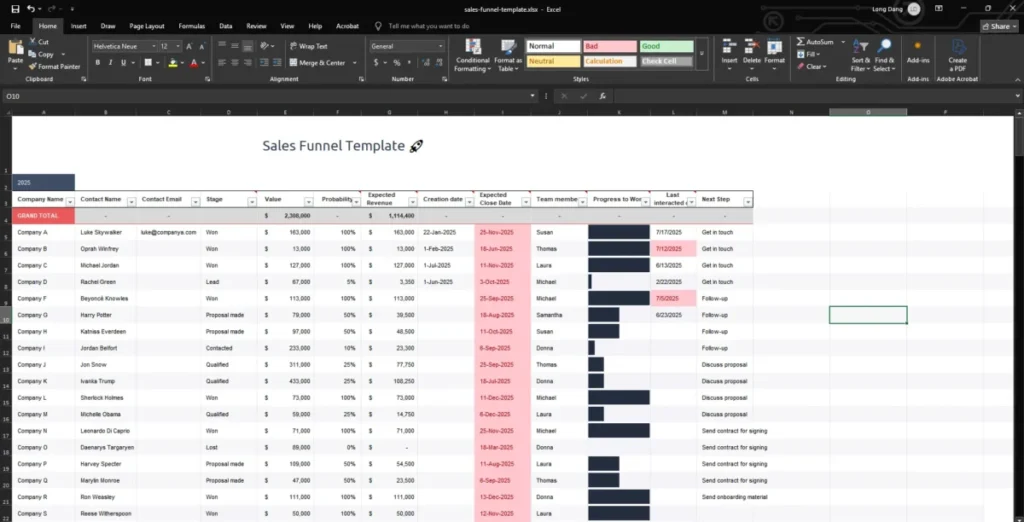
Read SF-003 rather than skimming it. The row carries a Lost Reason from the controlled list, which is what turns a dead deal into a countable pattern instead of a sentence in someone’s notes.
An aggregate summary, using the same synthetic data:
| Stage | Current count | Next stage count | Snapshot ratio | Drop-off count |
|---|---|---|---|---|
| Awareness | 100 | 60 | 60% | 40 |
| Interest | 60 | 30 | 50% | 30 |
| Consideration | 30 | 12 | 40% | 18 |
| Purchase | 12 |
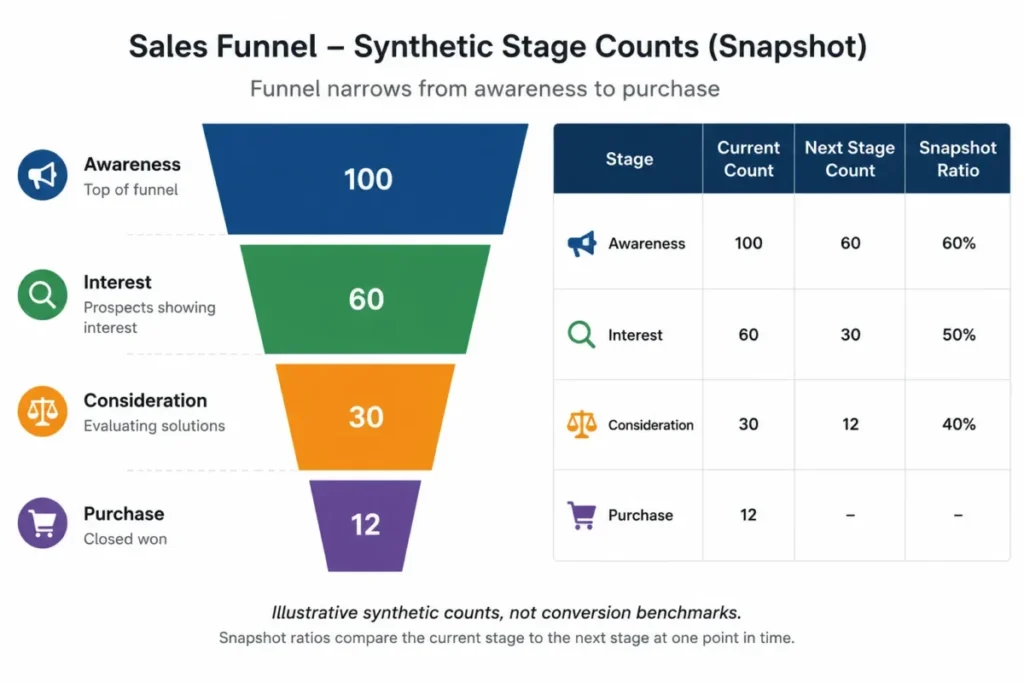
Those percentages are snapshot ratios calculated from one moment. Presented as cohort conversion they would be wrong, and presented as an industry benchmark they would be fiction.
The shape is still readable. The largest absolute loss sits between Awareness and Interest, which is the first place to investigate on a real board.
Which Version Fits Your Motion
| Motion | Stage preset | Fields to add | Field to drop |
|---|---|---|---|
| B2B consultative | Six stage set | Decision Maker, Competitor | Close Probability until you have history |
| SaaS | Lead through Evaluation to Closed | Trial Start Date, Product Usage flag | Deal Value on self-serve rows |
| Service business | Five stage set | Agreed Scope, Start Date | Expected Close Date if you invoice on signature |
| Ecommerce, aggregate | Four buyer stages, Summary tab only | Nothing, keep it aggregate | The entire row-level Tracker |
Spreadsheet or CRM: A Weighted Readiness Score
This is the one score in the article, and it is about your situation rather than any vendor. Rate each criterion from one to five, where five means the spreadsheet still handles it comfortably and one means it is already painful.
The weights below reflect what breaks first in practice: data discipline fails before feature depth does. Multiply each rating by its weight, then add the results.
| Criterion | Weight | Rate one to five | Evidence to record | Notes |
|---|---|---|---|---|
| Category discipline holds without policing | 0.25 | Your rating | Count of off-list values found in the last review | Dropdowns help, habits decide |
| One person can maintain the Lists tab | 0.15 | Your rating | Name of the current admin | An unowned rules tab rots fast |
| Stage history is genuinely not needed | 0.20 | Your rating | Whether anyone asked for time-in-stage last quarter | The base sheet cannot answer it |
| Activity capture by hand is sustainable | 0.15 | Your rating | Rows with a stale Last Contact Date | This is usually the first casualty |
| Access control needs are simple | 0.15 | Your rating | Number of people with edit rights | Sheet-level sharing is coarse |
| Reporting demands stay descriptive | 0.10 | Your rating | Reports requested that the tab cannot produce | Custom asks escalate quickly |
A worked example, for a five-person team with clean habits and no history requirement:
0.25 x 4 = 1.00
0.15 x 5 = 0.75
0.20 x 4 = 0.80
0.15 x 3 = 0.45
0.15 x 4 = 0.60
0.10 x 4 = 0.40
Weighted total = 4.00
That total lands in the middle band below. This team keeps the spreadsheet and fixes manual activity capture, which is its weakest criterion, before it hires a sixth person.
Decision thresholds, and one hard reject rule:
| Weighted total | Decision |
|---|---|
| 4.2 and above | Stay on the spreadsheet and revisit in two quarters |
| 3.5 to 4.1 | Stay, but fix the weakest criterion before adding people |
| 3.0 to 3.4 | Start evaluating tools now while the data is still clean |
| Below 3.0 | Migrate, and treat further spreadsheet work as sunk cost |
| Any criterion rated one | Migrate regardless of the total |
The reject rule exists because these criteria do not average out. A single failing dimension, usually access control or manual activity capture, causes more damage than three mediocre ones.
Red Flags in a Sales Funnel Spreadsheet
Any of these means pause the reporting and fix the sheet first.
| Red flag | Why it hurts | What to do |
|---|---|---|
| Stage values typed freely into rows | Exact-match counts split silently | Apply list validation, then clean history once |
| Two opportunities sharing one row | Every count and total is wrong | Split into separate rows with distinct IDs |
| Reused or blank Lead IDs | Dedupe and import both fail later | Regenerate IDs before you add another row |
| Stage changed, Stage Entered Date untouched | Age figures become meaningless | Make the date part of the movement habit |
| Ratios published with no stated denominator | Precise-looking numbers, no measurement | Label snapshot ratios, or publish counts alone |
| Borrowed stage probabilities | A forecast built on someone else’s business | Blank the field until you can calibrate it |
| Open rows with no owner | Nobody is accountable and nobody notices | Conditional format the blanks in red |
| Next action dates weeks past due | The tracker has become a graveyard | Weekly exception review, no exceptions |
| Closed Lost rows with free-text reasons | Loss patterns stay invisible | Controlled Lost Reason list, required on close |
| Merged cells inside the data table | Sorting, filtering, and import all break | Unmerge everything below the header row |
| The sheet lives in one person’s drive | One departure erases the pipeline | Shared drive, named backup owner |
| Anonymous web events pasted in as rows | Wrong data grain, unreadable sheet | Move event measurement to an analytics tool |
Common Mistakes
Eight failure patterns, each with the fix that prevents it.
| Mistake | Prevention |
|---|---|
| Treating funnel and pipeline as one object | Keep the Summary and Tracker tabs separate and connect them through the Stage field only |
| Shipping stage names with no criteria | Write the entry and exit condition before the first row is entered |
| Allowing free text in categorical fields | Point every dropdown at the Lists tab and reject off-list entries |
| Calling a snapshot ratio a conversion rate | Say which population and which window the number covers, every time |
| Importing stage probabilities from an article | Leave the field blank until your own closed rows can calibrate it |
| Assuming buyers move forward one stage at a time | Allow backward movement, reset Stage Entered Date, and note the reason |
| Expecting current-state rows to reconstruct history | Add a Stage History log if transitions matter, or move to a system that records them |
| Leaving open deals with no next action | Make Next Action and Next Action Date required while Outcome is Open |
The linearity mistake deserves the extra sentence. HubSpot’s guidance puts it plainly: the buyer’s journey no longer follows a straight highway from awareness to consideration to purchase, and in reality people take a lot of detours.
Your template should tolerate that instead of hiding it. A deal that slides from Proposal back to Discovery is information, not a data-entry error, so record the move and the date rather than quietly nudging it forward.
When Not to Use This Spreadsheet
Four situations where this workbook is the wrong instrument. Recognising them early is cheaper than discovering them at month nine.
| Situation | Why the sheet fails | Where to go instead |
|---|---|---|
| The funnel is mostly anonymous web traffic | Row-per-opportunity is the wrong data grain for event volume | Product or web analytics built for event streams |
| You need automatic activity capture and durable stage history | Manual entry decays, and overwritten dates erase the past | A CRM that logs transitions as events |
| Granular permissions, audit trails, or regulated data are in scope | Sheet sharing is coarse and edits are hard to attribute | A governed system with role-based access |
| A CRM is already the system of record | Parallel manual entry produces two conflicting truths | Report from the CRM, use the sheet for planning only |
If you land in one of the bottom three rows, spend one hour making the sheet importable before you shop. Migration-readiness is cheap while the data is small.
| Migration-readiness check | Why an importer cares |
|---|---|
| Every row has a unique, never-reused Lead ID | Becomes the external identifier that prevents duplicates |
| One current opportunity per row | Most importers map one row to one object |
| Categorical values come from a controlled list | Field mapping fails on near-duplicate labels |
| Dates stored as real dates, not text | Text dates import as strings and break every filter |
| Deal Value stored as a plain number, no currency symbols in the cell | Currency-formatted text fails numeric mapping |
| Owner recorded as a person, not a team label | Ownership assignment needs a resolvable user |
| No merged cells anywhere in the data table | Merged ranges corrupt row parsing |
| A header row that matches your field dictionary exactly | Speeds mapping and prevents silent column drift |
Run that checklist even if switching is nowhere on the roadmap. Every item on it also makes the spreadsheet itself more reliable.
What to Do After You Build the Template
Your next move depends on which part of the build hurt. Three honest paths, and none of them is “buy something immediately”.
If validation and category discipline were the hard part, the problem is process rather than tooling. Read up on lead management basics and settle your qualification definition before adding another field.
If the ratios felt untrustworthy, the gap is measurement design. Understanding how lead scoring works helps separate genuine qualification signals from activity noise, which is usually what makes early-stage numbers wobble.
If you want a more finished starting file rather than a build, two spreadsheet-first options exist. A ready-made CRM Excel template suits offline and Microsoft 365 teams, and a shared Google Sheets CRM template suits teams that need several people in the file at once.
If the readiness score pointed at migration, plan the move before you demo anything. Start with what CRM software does at a category level, then work through CRM migration planning so your clean spreadsheet stays clean on the other side.
Shortlisting comes last, and it should be scoped to your motion. Small teams and solo founders get better results from a CRM for small business teams, while a multi-rep outbound motion has different requirements from a CRM for sales teams.
Methodology and Sources
This template is an editorial build, assembled from official product documentation rather than from vendor marketing. Spreadsheet mechanics come from Google and Microsoft support documentation, and the sales-process concepts come from official Salesforce, Pipedrive, and HubSpot guidance.
Three criteria shaped every design decision. A field earns its place only if it changes a daily action, a formula ships only if it degrades safely on sparse data, and a metric appears only when its denominator can be named.
Sources were checked on 2026-08-07, and each factual statement about a spreadsheet capability links to the documentation page that supports it. Stage presets, weights, and thresholds are editorial recommendations, and they are labelled as such wherever they appear.
Sample rows, sample counts, and the worked scoring example are synthetic. They demonstrate mechanics, and no figure in them is presented as an industry benchmark.
FAQ
What is a sales funnel template?
A sales funnel template is a reusable structure for recording where buyers sit in your sales process and what happens next on each opportunity. A working one pairs stage labels with observable entry and exit criteria, controlled category lists, and formulas whose denominators you can name.
What are the stages of a sales funnel?
Buyer-side funnels usually run through awareness, interest, consideration, and purchase. Seller-side pipelines translate those into operational steps such as New, Qualified, Discovery, Proposal, Negotiation, and Closed, and the exact sequence should mirror how your team sells rather than any published standard.
How do I create a sales funnel in Excel?
Build four tabs, put your controlled values on the Lists tab, and apply Data Validation list rules to Stage, Lead Source, Outcome, and Lost Reason. Add stage counts with COUNTIF on the Summary tab, wrap each ratio in an IF that returns blank when the denominator is zero, and add a funnel chart from the stage-and-value columns if you want the visual.
How do I create a sales funnel in Google Sheets?
The build is identical, with dropdowns in place of Data Validation lists. Google Sheets rejects off-list entries by default, and its custom-formula conditional formatting handles the exception flags for missing owners and past-due next actions.
What should a sales funnel template include?
At minimum: a stable row identifier, current stage, stage entered date, owner, next action, next action date, outcome, and a controlled lost reason. Value and probability fields are optional and belong only in motions where a monetary amount is meaningful.
What is the difference between a sales funnel and a sales pipeline?
The funnel is the buyer’s journey viewed in aggregate, and the pipeline is the seller’s working view of individual opportunities. That is why this template keeps them on separate tabs and joins them through a single Stage field.
How do you calculate sales funnel conversion rate?
Divide the count that reached the next stage by the count that entered the current stage, using the same group of records and the same time window. If all you have is a single set of live stage counts, you have a snapshot ratio rather than a conversion rate, and labelling it accurately is more useful than the extra decimal place.
How do you calculate drop-off in a sales funnel?
Subtract the next-stage count from the current-stage count for the absolute number, or subtract the ratio from one for the rate. Both figures inherit whatever comparability problem the underlying counts have, so state the population alongside the number.
Can a spreadsheet replace a CRM for a small sales team?
For a handful of people tracking identifiable opportunities by hand, yes, for a while. It stops working when you need automatic activity capture, durable stage history, granular permissions, or an audit trail, and the readiness score above is designed to tell you which of those arrived first.
When should I move from this template to a CRM?
Move when the sheet can no longer answer a question your team keeps asking, most often time-in-stage history or who changed what. Run the migration-readiness checklist first, because clean spreadsheet data is the cheapest possible starting point for an import.