

A sales pipeline is the set of open, qualified deals a team is working, grouped by how far each has moved toward a signed contract. Every deal in it carries a value, an owner, a next step and an expected close date.
A pipeline is important because it answers three weekly questions: what will close and when, which deals are stuck, and whether there is enough pipeline to hit the target.
A small B2B team can run it on five open stages: Qualified, Discovery, Demo, Proposal and Negotiation, after which every deal ends as Won or Lost.
The number that turns that list into an expected result is weighted value: each deal’s amount multiplied by its stage’s win probability, then summed.
One illustrative four-rep team runs through every section below: its stages, its numbers, the pipeline it needs and the repairs. The “Where CRM Software Fits” section compares the CRM plans that handle pipelines and forecasting, with prices checked in October 2026.
In This Article (7 sections)
What a Sales Pipeline Is and Is Not
A sales pipeline holds deals, not contacts. A contact becomes a deal only after the buyer confirms a need, a budget range and a decision timeframe.
Each field on a deal has a job. The stage says how far the buyer has gone, value and close date feed the forecast, and owner and next step say who acts and when.
That makes the pipeline a snapshot of live work, acted on deal by deal, rather than a report on last quarter. Deal pipeline and opportunity pipeline are synonyms, since opportunity is another word for deal.
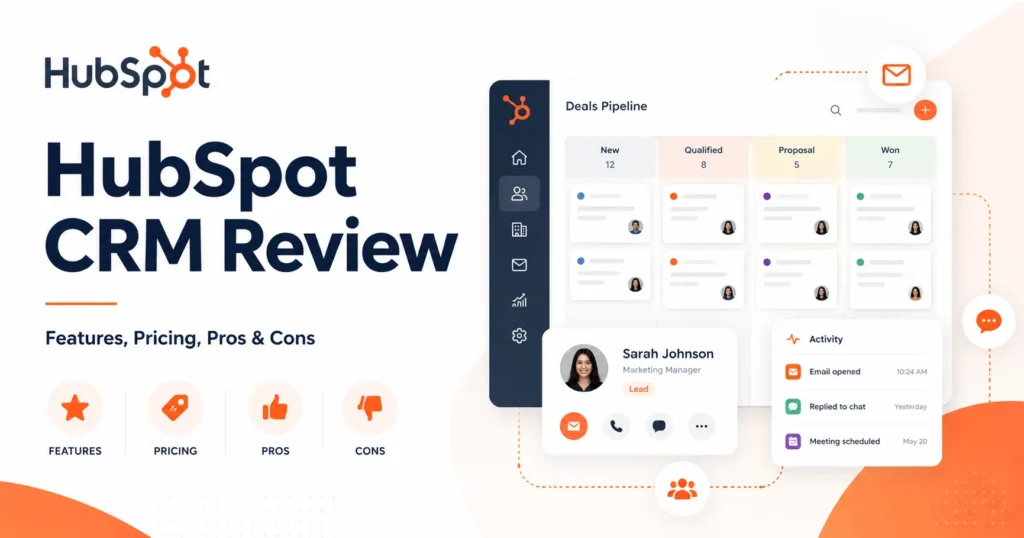
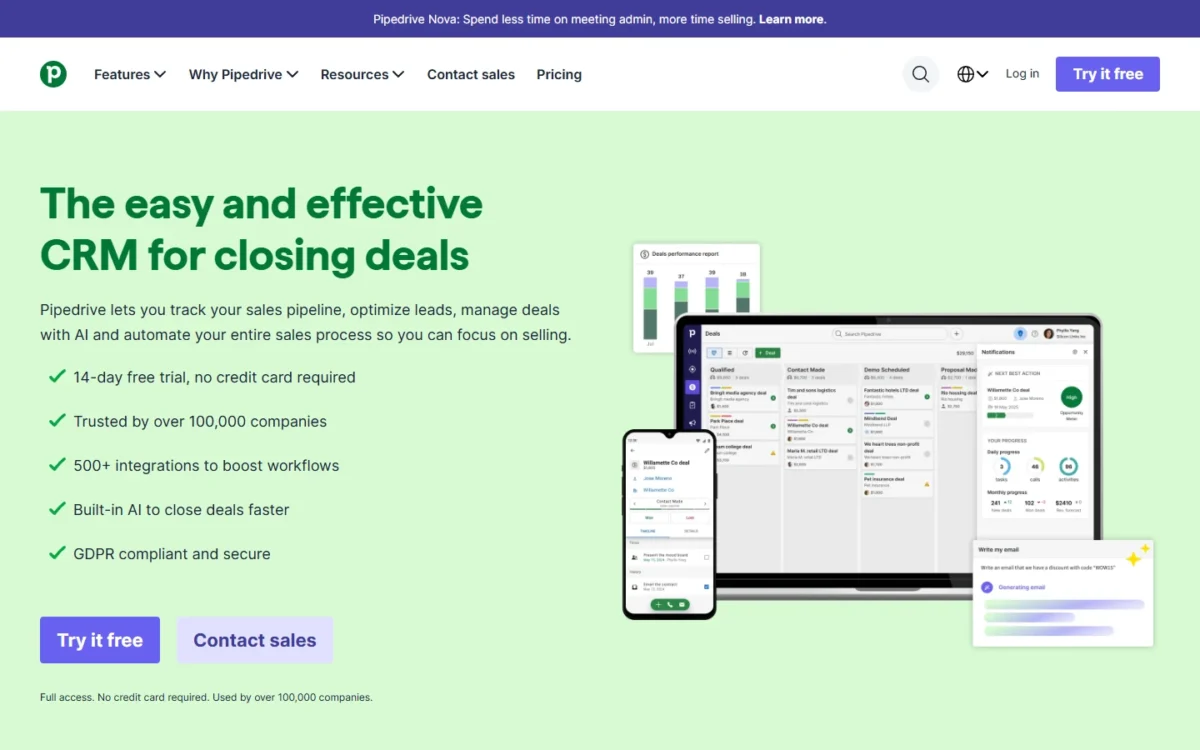
In CRM software, the pipeline is drawn as a board of deal cards, which HubSpot calls board view.
Four neighboring terms get confused with the pipeline, and each answers a different question:
| Term | What it holds | Unit | Time frame | Question it answers |
|---|---|---|---|---|
| Sales pipeline | Open, qualified deals by stage | Deals and dollars | Today | Which deals need work, and what will likely close? |
| Sales funnel | Share of deals moving from stage to stage | Percent | A past period | Where do deals drop out? |
| Sales forecast | Revenue expected to close | Dollars | This month or quarter | What will the team book? |
| Sales process | The steps a team follows to sell | Steps and exit rules | Until redesigned | What should happen next on a deal? |
| Lead list | Contacts not yet qualified | Contacts | Ongoing | Who should reps try to qualify? |
The forecast is calculated from the pipeline, so stale or unqualified deals produce a wrong forecast, however good the forecasting tool is.
Forecast reports also reuse the word itself. HubSpot’s forecast tool names its low-likelihood category Pipeline, next to Best case and Commit, so a “Pipeline” total there means the deals least likely to close.
Sales pipeline vs sales funnel
The pipeline lists the open deals and where each stands today; the funnel measures the share of deals that moved between stages over a past period. They are two views of the same stages.
In the example below, the pipeline is the team’s open deals and their value. The funnel is its last batch of qualified deals, narrowing to the few it won. The funnel shows where deals leak; the pipeline shows which deals to work this week.
A sales funnel template turns stage counts like these into conversion rates in a spreadsheet. Either view is only as good as stages that mean the same thing to every rep, so the stage rules come next.
Sales Pipeline Stages and What Moves a Deal
There is no standard number of stages. A small B2B team can run five open stages plus Won and Lost, and a deal moves only when the buyer does something the rep can verify.
That answers the common question about the five stages of a sales pipeline. Stage names vary by team; the rule behind each move should not.
| Stage | A deal enters when the buyer | The rep records |
|---|---|---|
| Qualified | Confirms a need, a budget range and a decision timeframe | Value, close date, next step, owner |
| Discovery | Joins a discovery call and names who signs off | The problem in the buyer’s words, the decision makers |
| Demo | Attends a demo with the people who sign off | Objections and what success looks like |
| Proposal | Asks for a proposal or quote | Amount and the buyer’s decision date |
| Negotiation | Sends back terms or a marked-up contract | Open terms and the expected signature date |
| Won | Signs | Final amount and start date |
| Lost | Declines, picks another option or misses two agreed next steps | The lost reason |
Buyer actions keep stages honest. A rep can mark a demo “done” after a call the decision maker skipped, but a calendar invite the decision maker accepted is on record.
HubSpot’s default deal pipeline attaches a win probability to each stage. It starts at 20% for Appointment scheduled, then sets Qualified to buy at 40%, Presentation scheduled at 60%, Decision maker bought-in at 80% and Contract sent at 90%. Closed won and Closed lost end it.
Treat those probabilities as placeholders, not facts about your buyers. The example that follows replaces them with a team’s own history.
Where prospecting and leads fit
Prospecting is not a pipeline stage; it is the feed. A contact enters the pipeline only when it passes the entry rule in the Qualified row above.
Stage lists that start with prospecting and end with post-sale steps mix lead work and account work into deal value, which inflates the total. HubSpot keeps the two apart: its default Lead pipeline runs through New, Attempting, Connected, Qualified and Disqualified, separately from deals.
Sales Pipeline Example: A Four-Rep Team in Numbers
Take an illustrative team of 4 reps selling one product. Every deal is worth $6,000, the quarterly target is $90,000 and the team’s sales cycle, from Qualified to Won, is 60 days.
Of its last 200 qualified deals, all now closed, 160 reached Discovery, 125 reached Demo, 100 reached Proposal, 50 reached Negotiation and 40 were won; the other 160 were lost.
Dividing the 40 wins by the deals that reached each stage gives the team’s own win chance from every stage:
- Qualified: all 200 deals started here, and 40 of 200 won, a 20% win chance.
- Discovery: 40 of 160, 25%.
- Demo: 40 of 125, 32%.
- Proposal: 40 of 100, 40%.
- Negotiation: 40 of 50, 80%.
These figures are invented to show the method, not to benchmark any industry.
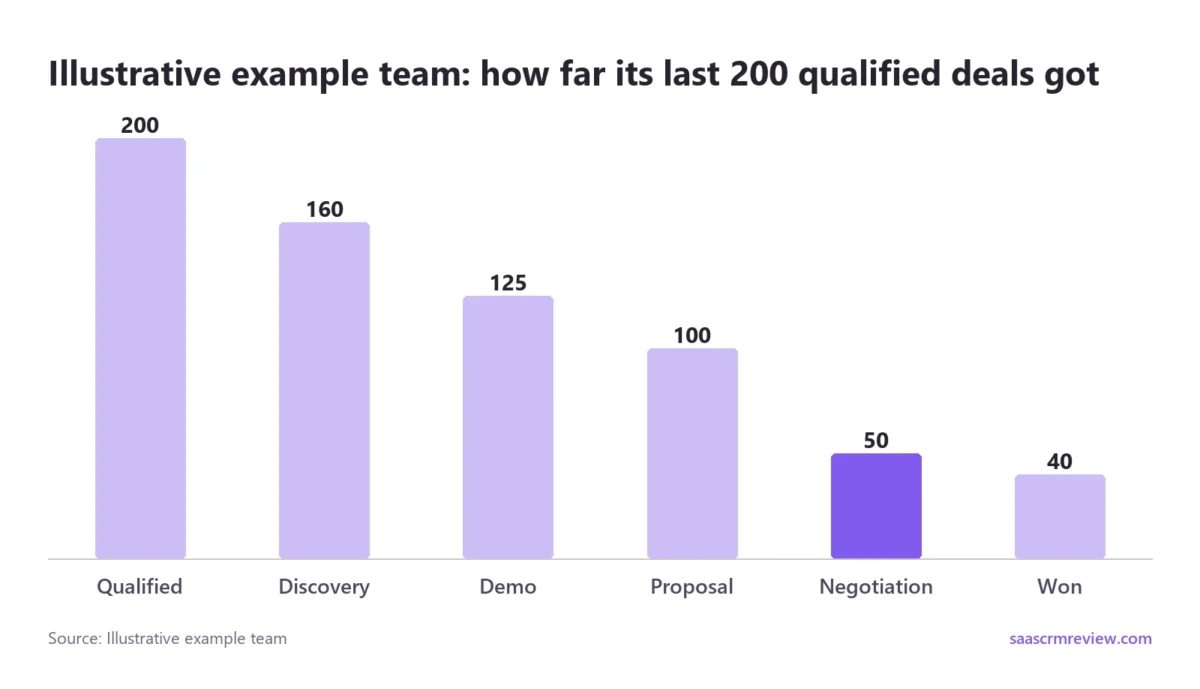
The chart shows where this team leaks: 100 proposals turned into only 50 negotiations.
The live pipeline holds 48 open deals expected to close this quarter. Multiplying each stage’s value by its win chance gives the weighted value:
| Stage | Open deals | Value at $6,000 a deal | Win chance | Weighted value |
|---|---|---|---|---|
| Qualified | 20 | $120,000 | 20% | $24,000 |
| Discovery | 12 | $72,000 | 25% | $18,000 |
| Demo | 8 | $48,000 | 32% | $15,360 |
| Proposal | 6 | $36,000 | 40% | $14,400 |
| Negotiation | 2 | $12,000 | 80% | $9,600 |
| Total | 48 | $288,000 | Mixed | $81,360 |
Sources: Illustrative example team (invented deals); weighted value is amount x stage probability, the method in HubSpot’s pipeline settings, checked October 2026.
One won deal from last quarter shows the buyer action behind each move:
- Day 0, Qualified: the buyer’s operations lead confirms the problem, a budget near $6,000 and a decision before quarter end.
- Day 9, Discovery: the buyer joins a discovery call and names the two people who sign off.
- Day 21, Demo: both of those people attend the demo.
- Day 30, Proposal: the buyer asks for a proposal and confirms a decision date.
- Day 44, Negotiation: the buyer’s legal team returns the contract with two changes.
- Day 58, Won: the buyer signs, two days inside the team’s 60-day cycle.
Every move carries a date set by something the buyer did, so the stage history doubles as an audit trail. The open pipeline totals $288,000 against a $90,000 target, and the metrics say whether that is enough.
Pipeline Metrics and Formulas
Six numbers say whether the illustrative pipeline above reaches its $90,000 target. Here the answer is no: its weighted value, the $81,360 total of the stage table, lands $8,640 short.
| Metric | Formula | Example result | Trap |
|---|---|---|---|
| Total pipeline value | Sum of open deal values | $288,000, 3.2 times the $90,000 target | Counts every deal at full value |
| Weighted value | Sum of value x stage win chance | $81,360, $8,640 below the $90,000 target | Only as good as the probabilities |
| Stage conversion | Deals reaching the next stage ÷ deals reaching this one | Proposal to Negotiation: 50 of 100, 50% | Small samples swing it |
| Win rate | Won ÷ (won + lost) | 40 ÷ (40 + 160) = 20% | Leaving stalled deals open inflates it |
| Sales cycle | Average days from Qualified to Won | 60 days | One long deal skews the average |
| Pipeline velocity | Open deals x average value x win rate ÷ cycle days | 48 x $6,000 x 20% ÷ 60 = $960 a day | Mixed deal sizes blur it |
Sources: Illustrative example team’s figures; weighted value follows HubSpot’s forecast settings, checked October 2026.
Total value suggests a safe 3.2 times coverage. Weighted value tells the truer story, because 20 of the 48 open deals sit in Qualified, where only 1 in 5 closes.
Velocity reaches the same verdict from another angle: $960 a day x 90 days in the quarter = $86,400, which is $3,600 short of the $90,000 target. Use velocity to compare quarters and weighted value to forecast this one.
The lever is the Proposal stage. Every other step keeps about four deals in five, but only 50 of 100 proposals reach Negotiation.
Suppose 60 of 100 proposals reached Negotiation, and Negotiation still closed 80% of its deals, 48 of 60. Wins would rise from 40 to 48 of 200, a 24% win rate.
Keep the 48 open deals and apply the new win rate of 48 in 200 (24%): velocity becomes 48 x $6,000 x 24% ÷ 60 = $1,152 a day.
That is a fifth more than $960. Matching it through volume would take about 10 more open deals, so the proposal fix comes first.
Closing the $8,640 gap takes better conversion, as above, or more pipeline, and the next question sizes the second option.
How much pipeline does your team need?
Divide the target by the win rate to size the pipeline a quarter needs.
For the illustrative team above, with a win rate of 40 deals in 200 (20%), a $90,000 quarter needs $90,000 ÷ 20% = $450,000 of newly qualified pipeline, five times the target.
At $6,000 a deal, that is $450,000 ÷ $6,000 = 75 new qualified deals a quarter, about 19 for each of the 4 reps.
Lift the win rate to 48 in 200 (24%), as in the proposal fix above, and the need drops to $90,000 ÷ 24% = $375,000, about 63 deals.
Coverage is 1 ÷ win rate: the example’s 20% gives 1 ÷ 20% = 5x the target, while a 3x coverage target assumes a win rate near 1 in 3 (1 ÷ 3 = 33%). Two adjustments keep the number honest.
Count deals already past Qualified at weighted value, not face value. With a 60-day cycle, deals qualified in a quarter’s last month close in the next one, so treat $450,000 as a rolling quarterly pace.
What a pipeline report should show
A manager’s pipeline report needs five views, and each catches a different failure:
- Value by stage, total and weighted, shows whether the quarter is covered.
- Value by rep shows who carries the team and who has nothing late-stage.
- Value by expected close month catches deals piling up at quarter end.
- Aging, the days each deal has sat in its current stage, finds stalled deals.
- Won and lost deals with reasons explain why the funnel leaks where it does.
All five views read the same deal fields, so one missing close date or next step breaks the report, not only the deal.
How to Build or Fix a Pipeline
Building a pipeline that predicts revenue takes seven steps, and the same seven repair one that has stopped predicting it:
- Write the entry rule down. Make it the only door into the pipeline: no confirmed need, budget range and timeframe, no deal.
- Map stages from your recent won deals. List what each buyer did; the actions most deals share become your stages.
- Give each stage one buyer exit. The rep must be able to point to an email, an accepted invite or a document.
- Set win chances from your own history. Divide wins by the deals that reached each stage, as in the example; vendor defaults are placeholders until then.
- Require four fields at every stage change. Value, close date, next step and owner. In HubSpot, a conditional stage property marked Required blocks the update until it has a value; Pipedrive includes required fields on Premium and Ultimate.
- Review weekly with a stale-deal rule, using the routine below.
- Recalibrate every quarter. Recompute win chances and stage conversion from the quarter’s closed deals.
Add a second pipeline only when a second sales process has its own stages. Splitting deals by salesperson, location or industry belongs in the owner field, custom fields and filters, as Pipedrive’s guidance on multiple pipelines advises.
When a pipeline already exists and misleads, start from the symptom rather than the setup.
How to identify and fix a broken pipeline
A pipeline that looks full while the forecast keeps missing usually has one of six faults, and each leaves a symptom in the report:
| Symptom | Likely cause | Fix |
|---|---|---|
| Big total, low win rate | Unqualified contacts entered as deals | Enforce the entry rule; move contacts back to leads |
| Deals idle for weeks | No exit criterion or next step | Require a dated next step at every stage change |
| Close dates keep slipping | The date is the rep’s hope, not the buyer’s | Use the buyer’s stated decision date and log each slip |
| One stage bulges | A bottleneck at that stage’s exit | Fix the exit, as with the example’s proposals |
| Forecast misses despite clean data | Vendor default probabilities | Replace them with your own win chance per stage |
| Reps skip updates | Too many stages or required fields | Cut stages to buyer actions and fields to the four |
Work down the table in order. An unqualified entry distorts every number below it, so the entry rule gets fixed before anything else.
The weekly pipeline review
A weekly review, run from the pipeline report, keeps the pipeline true. This is the routine I suggest for a small team, not an industry standard:
- Changes since last week: new deals, stage moves, wins and losses.
- Stale deals: a deal idle for more than twice its stage’s usual time gets a dated next step or moves to Lost.
- Late-stage next steps: every Proposal and Negotiation deal needs a next step dated with the buyer.
- Lost reasons: a reason that repeats points to a process fault, not bad luck.
Take item 2 with the illustrative deal traced above, where Proposal ran 14 days, from Day 30 to Day 44. If that is the usual time, a proposal idle for more than 28 days, twice 14, is stale.
A CRM can run the stale-deal check for you. Pipedrive’s Rotting feature turns a deal tile red once the deal passes the idle days set for its stage.
Where CRM Software Fits
You do not need a CRM to start. One or two sellers with a few dozen open deals can run a pipeline in a spreadsheet, and free Google Sheets CRM templates give it a ready structure.
A CRM starts to make sense when several reps share deals, when stage dates must be recorded without anyone typing them, and when a missed follow-up loses a sale.
The illustrative team above, with 4 reps and 48 open deals, is past that point.
Whatever tool runs the pipeline should do five things:
- Show a board with each stage’s total and weighted value.
- Let you edit stages and win probabilities, so your history replaces the defaults.
- Require fields when a deal changes stage.
- Hold a second pipeline for a second sales process.
- Flag stale deals and produce a forecast view.
To pick the tool itself, start with the CRMs ranked for sales teams, which I order by sales fit.
When marketing or other teams will work in the same records, the choice widens to the best CRM software overall.
On that checklist, plans split on a second pipeline and on forecasting, and Pipedrive also gates required fields, which start on Premium.
Pipeline features by CRM plan
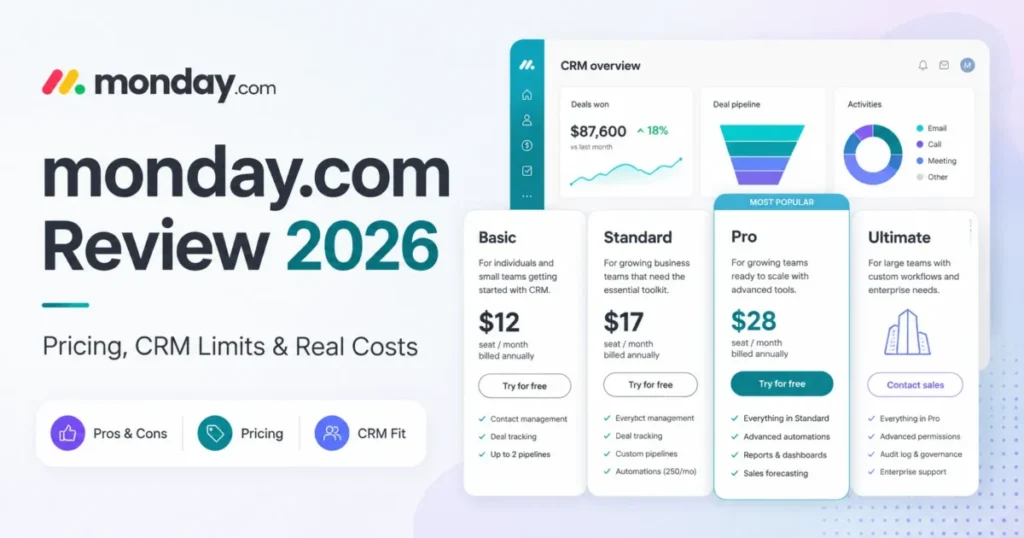
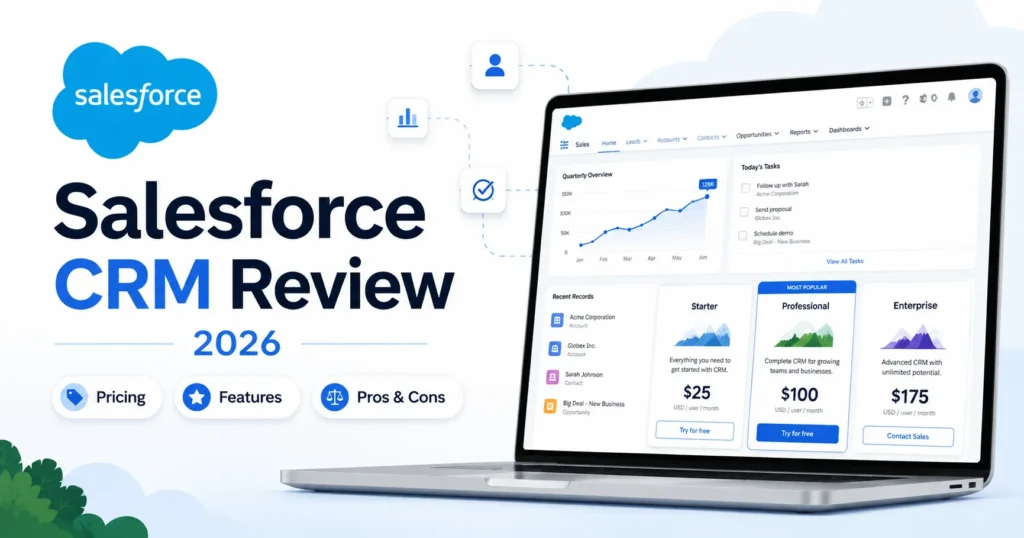
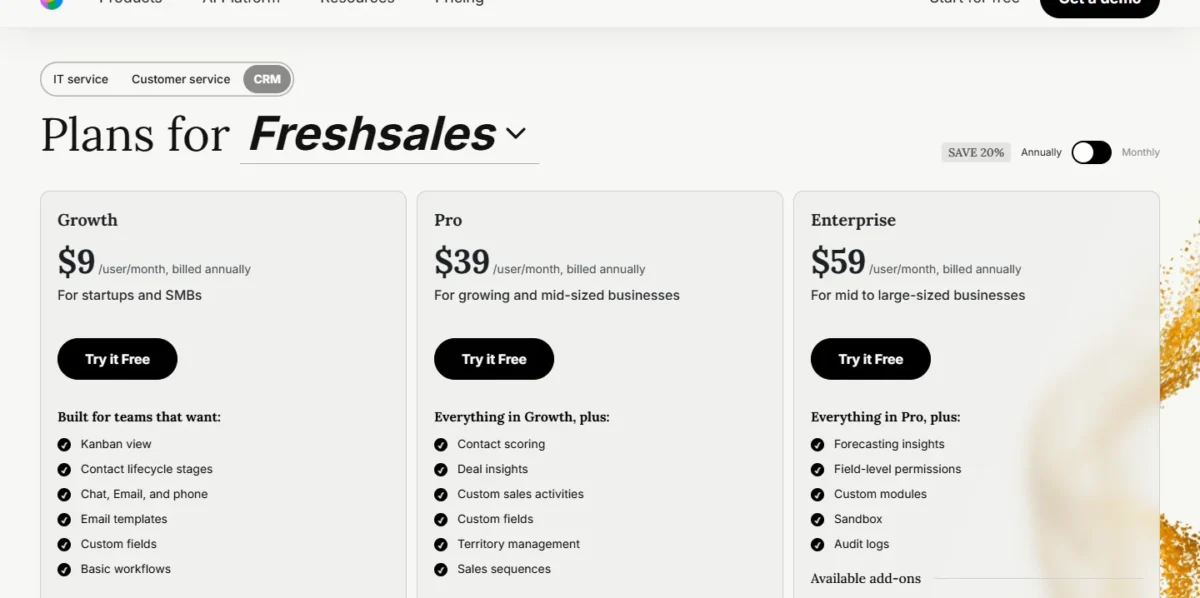
As of October 2026, the three CRMs gate the two pipeline upgrades differently. A second pipeline needs HubSpot Starter or Freshsales Pro but comes with Pipedrive Lite and up. Forecasting starts on HubSpot Professional, Pipedrive Growth and Freshsales Enterprise.
| Feature (prices per user per month, billed annually) | HubSpot | Pipedrive | Freshsales |
|---|---|---|---|
| Free plan or trial | Free plan for up to 2 users | 14-day free trial | 21-day free trial |
| Cheapest paid plan with a deal board | None needed up to 2 users: the free plan has one default deal pipeline | Lite, $14 ($19 billed monthly) | Growth, $9 ($11 billed monthly) |
| More than one pipeline | Starter, 15 custom pipelines | Lite and up (customizable pipelines) | Pro, $39 ($47 billed monthly), 10 pipelines; Enterprise, 25; Growth, 1 |
| Forecasting | Professional, $90 ($100 paid monthly on an annual commitment), plus $1,500 one-time onboarding | Growth, $24 ($34 billed monthly) | Enterprise, $59 ($71 billed monthly) |
Sources: HubSpot Sales Hub pricing, HubSpot pipeline limits, Pipedrive pricing, Pipedrive plan features, Freshsales pricing, Freshsales pipeline limits, checked October 2026.
The free HubSpot plan stops at 2 users, so the four-rep example team pays from Starter before forecasting enters the picture. HubSpot adds deal journey analytics on Enterprise.
What the cheapest plan with forecasting costs the four-rep team in its first year, billed annually:
- HubSpot Sales Hub Professional: $90 x 4 seats x 12 months + $1,500 onboarding = $5,820
- Pipedrive Growth: $24 x 4 seats x 12 months = $1,152
- Freshsales Enterprise: $59 x 4 users x 12 months = $2,832
For the example team, that makes HubSpot’s first year about five times the cost of Pipedrive’s. The totals say nothing about what each forecasting tool does.
HubSpot’s forecast tool tracks each rep against a revenue goal and sorts deals into categories such as Best case and Commit. Pipedrive Growth adds a forecast view, and Freshsales Enterprise adds forecasting insights.
HubSpot’s extra spend is justified only if the manager will use its rep-level revenue goals and forecast categories, so compare what the other two show before choosing.
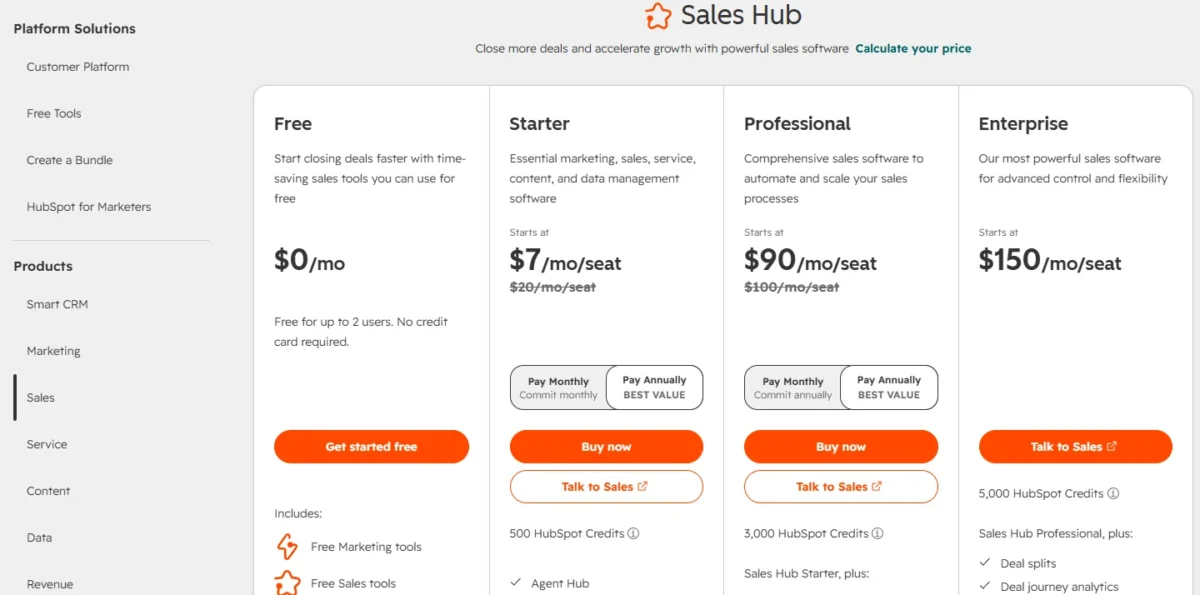
On HubSpot’s pricing page, Professional’s Pay Monthly option shows $100 per seat but still reads Commit annually, so paying monthly does not shorten the contract.

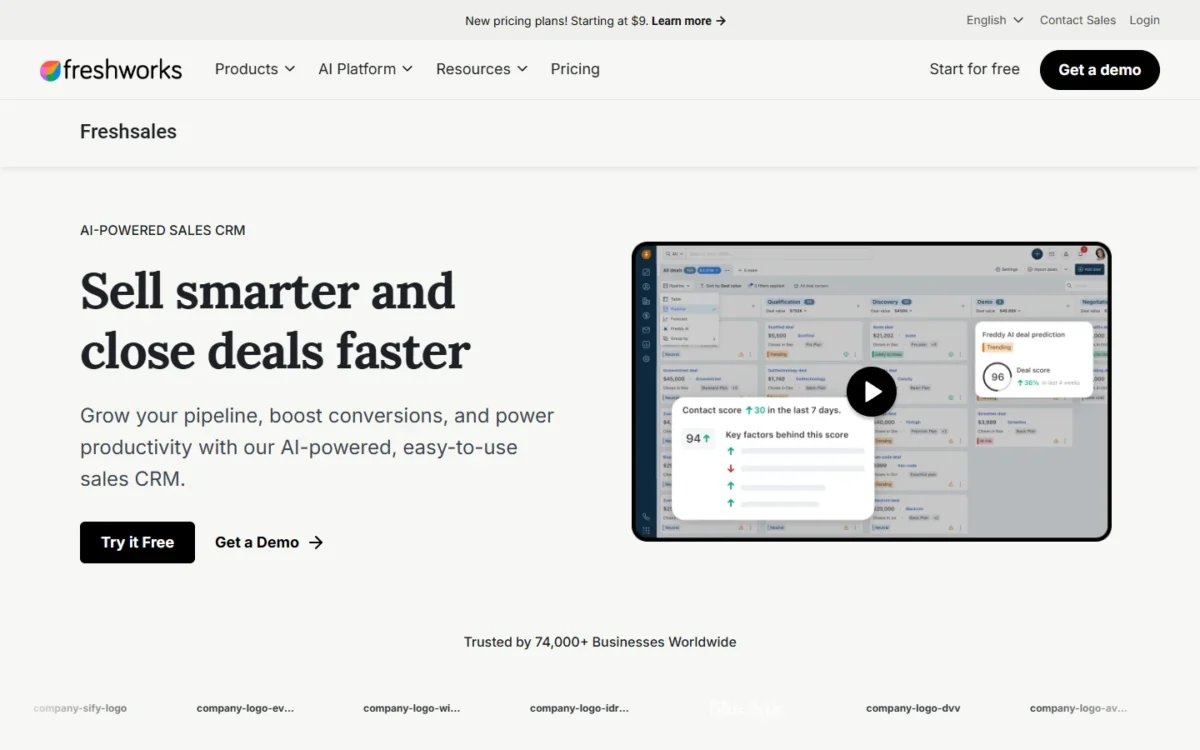
Freshsales reserves forecasting insights for Enterprise, while Growth already includes the Kanban view a small team needs to see its deals by stage.
If Pipedrive and Freshsales are your final two, my Pipedrive vs Freshsales comparison weighs them for sales teams.
To work out a yearly total for your own team, start with the CRM cost calculator.
My read for a team of 2 to 10 sellers: buy the cheapest plan that gives you a deal board and stages you can edit. Add forecasting after a quarter of clean weekly reviews.
By default, HubSpot’s forecast tool multiplies each deal’s amount by its deal probability, so stage probabilities left at their defaults carry straight into the forecast.
On Pipedrive, the required-fields gate sits a tier above Growth, where forecasting already starts, so until Premium the weekly review is what enforces the four fields.
Pipeline FAQ
Short answers to five common questions:
How do you create a sales pipeline?
Start with one record per deal, in a spreadsheet or a CRM, holding its stage, value, owner, next step, expected close date and the date it entered its current stage. The seven steps above then set the rules those fields follow.
How many deals should each rep work on?
Work backward from the win rate: divide the target by the win rate and by the deal value, then share the result across the reps.
For the illustrative team above, $90,000 ÷ 20% ÷ $6,000 = 75 new qualified deals a quarter, which across 4 reps is about 19 per rep, or about 6 a month.
When does a team need a second pipeline?
When it sells a second way, with different steps. HubSpot’s own example is an online store whose orders run from cart to closed, next to a wholesale process that needs appointments and contract negotiation.
Is a sales pipeline the same as a CRM?
No. The pipeline is your deals and the rules that move them; a CRM is the software that stores them, along with contacts, emails and activity history.
Is there a sales pipeline template?
Yes. A spreadsheet is enough for a small pipeline, and a free CRM Excel template built for later import saves rework when the team moves to a CRM.