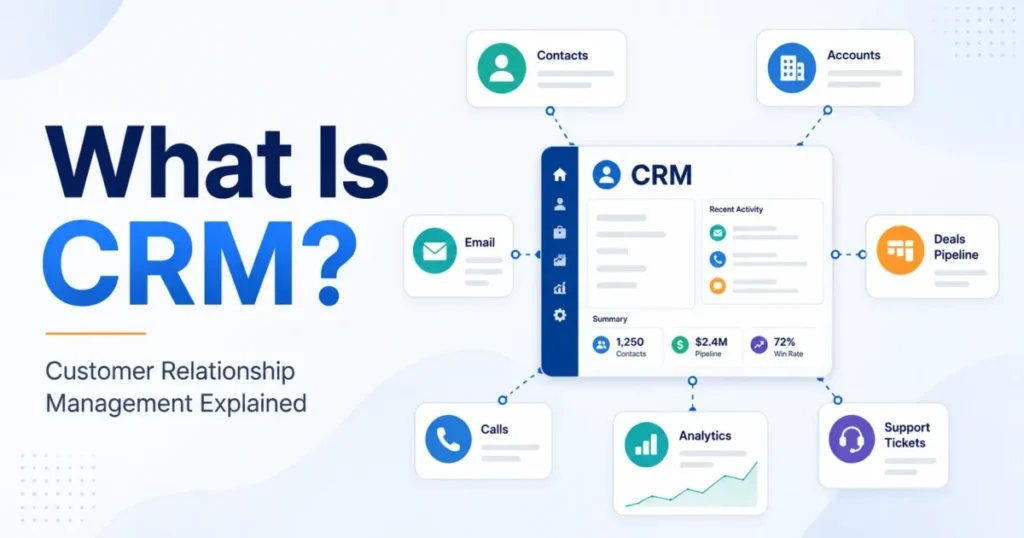

A CRM dashboard is a screen inside CRM software that shows saved reports on the CRM’s own records as charts, KPIs and target meters, so a team reads its pipeline, activity and service numbers at a glance. Each audience gets its own view, such as Salesforce’s Salesperson and Service Executive Overview dashboards.
It charts only the data the CRM holds, and vendor plans cap its size: a Pipedrive dashboard holds at most 25 reports, and a Zoho CRM dashboard at most 20 components.
It fits a sales manager or owner who already runs deals in a CRM; one to three people on a spreadsheet can start with a template dashboard. The numbers mean little until each KPI has a formula and a date range.
Key facts
A dashboard is built from saved reports, so the reports come first. Four types cover most teams: sales, marketing, service and executive.
In Pipedrive, a second dashboard needs Premium or higher, and Insights reports per user run from 15 on Lite to 500 on Ultimate, as checked in November 2026.
In This Article (8 sections)
How It Works: From CRM Records to Reports to a Dashboard
A CRM dashboard sits at the end of a short chain: the CRM stores records, a saved report asks one question of those records, and the dashboard places several reports on one screen as components. The records are the contacts, companies, deals and activities at the center of what CRM software does.
- Records: contacts, companies, deals, tickets and custom objects, the record types HubSpot’s custom report builder lists.
- Reports: a saved report filters and groups one set of records, such as deals won per month.
- Components: each report displays as a chart, a KPI figure, a funnel or a target meter.
- Dashboard: the components share one screen, with period and user filters.
- Decision: the reader chases a stalled deal, coaches a rep or changes the forecast.
Pipedrive’s help center defines its sales dashboard as a customized collection of reports, and the same report can be added to several dashboards. So the reports come first, and the dashboard is only their arrangement.
What a component can be depends on the CRM. Zoho CRM offers components from charts, KPIs and comparators to an anomaly detector, target meters, funnels, and cohort, quadrant, zone and stage analysis. Zoho’s Bigin keeps to three: charts, KPIs and target meters, and its target meters are available only in the Premier, Bigin 360 and Zoho One editions.
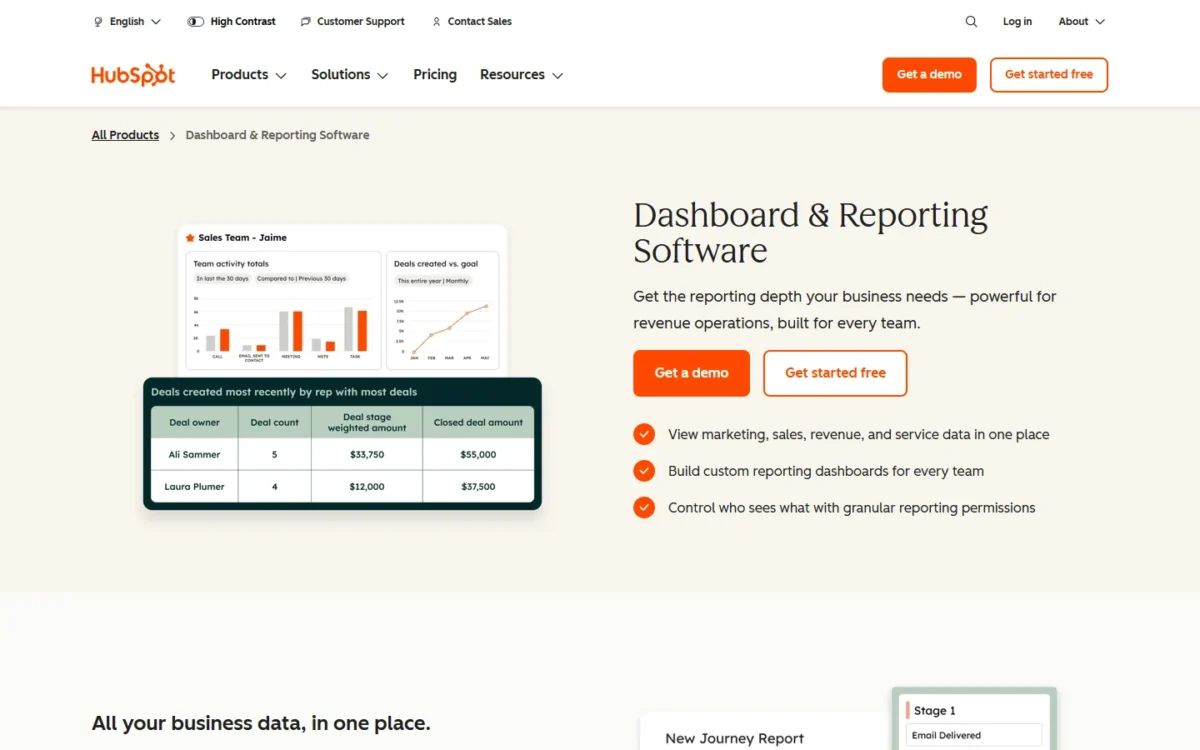
Pick the chart type by the question the component answers. Zoho CRM supports bar, horizontal, line, stacked, pie, donut, table, funnel and area charts. A funnel suits stage-to-stage drop-off, and a line chart suits a trend across months.
A dashboard number also opens the records behind it. In Zoho CRM, clicking a chart, KPI, target meter or comparator opens a drilled-down report, and Bigin shows the matching records in a list view.
Filters and refresh decide what you are looking at. In Pipedrive, the period and user filters change what the dashboard shows without changing the data in the reports. A Pipedrive dashboard shared by public link updates on a default one-hour interval when a different user opens it. Pipedrive markets live dashboards with real-time information, so the link, not the dashboard inside the CRM, is where a lag can appear.
Integrations: where the dashboard’s data comes from
Data from other apps has to be connected before a dashboard can chart it, and the vendors split the work differently.
- Pipedrive’s pricing page lists 500+ integrations.
- HubSpot’s reporting page says its reporting natively connects CRM, marketing, sales, service and content data with no manual syncing, and its Enterprise edition adds Data Hub connections to Snowflake, BigQuery, Redshift and Databricks.
- Tools listed in the HubSpot App Marketplace can feed HubSpot’s sales reports when their data is shared with HubSpot.
In HubSpot, warehouse connections sit on Enterprise, so a team on Professional should not plan a dashboard around warehouse data.
CRM dashboard vs report vs BI tool vs spreadsheet
A report answers one question, a dashboard shows several reports at once, a BI tool joins CRM data with other systems, and a spreadsheet is the manual version of all three.
| Option | What it holds | Who builds it | Best for |
|---|---|---|---|
| Spreadsheet | Rows the team types or pastes in | Whoever owns the file | One to three people tracking a short deal list |
| CRM report | One question about one set of records, such as deals won by month | A CRM user with report access | Digging into a single number |
| CRM dashboard | Several saved reports as components on one screen | A manager or admin, from saved reports | Reading the state of sales or service in a minute |
| BI tool | CRM data joined with finance, product or warehouse data | An analyst or operations lead | Questions that cross systems |
HubSpot’s custom report builder, which arrives with the Professional edition, covers contacts, companies, deals, tickets and custom objects with no separate BI tool, so on Professional a question that stays inside the CRM rarely needs one.
A team of one to three with a short deal list can stay on the first row, and a free CRM Excel template with a dashboard tab covers that stage. Once a dashboard is a set of reports, the question becomes which set your role needs.
Types of CRM Dashboards: Sales, Marketing, Service and Executive
CRM dashboards come in four types by audience, sales, marketing, customer service and executive, and each type exists to answer a different question.
| Type | Who reads it | Question it answers | Typical KPIs | Vendor example |
|---|---|---|---|---|
| Sales | Reps and sales managers | Will the team hit its number, and which deals need work? | Pipeline value, win rate, average deal size, sales cycle length | Salesforce’s Salesperson and Sales Manager dashboards |
| Marketing | Marketing lead or owner | Which sources bring leads that become deals? | Leads by source, lead-to-deal conversion rate, customer acquisition cost | Salesforce’s Marketing Executive Dashboard |
| Customer service | Support lead and agents | Are cases answered and closed on time? | First response time, average resolution time, CSAT | Salesforce’s Agent Supervisor Overview and Service KPIs dashboards |
| Executive | Owner or executive | Is revenue on target, and what is the forecast? | Quota attainment, weighted pipeline, churn rate | Salesforce’s Sales Executive and Service Executive Overview dashboards |
Sources: Salesforce CRM Dashboards on AppExchange, HubSpot dashboard and reporting software, checked Nov 2026.
HubSpot sorts its pre-built dashboards along the same lines: marketing, sales, revenue and service. Build the type whose question you get asked most often, and add the next one only when someone needs it.
Sales dashboards: rep and manager views
A rep’s dashboard tracks that rep’s own deals and activities, while a manager’s tracks the whole sales pipeline and the team’s progress to target.
HubSpot’s pre-built sales reports cover both views: deal forecasts, prospecting and sales activities, plus pipeline revenue, target attainment and rep coaching insights. Sales teams with a manager need both, because one rep’s sales performance and the whole team’s performance are different questions.
Every sales view rests on stage data. Define the stages before the charts, since how a sales pipeline is structured decides what a pipeline chart can show.
Marketing dashboards
A marketing dashboard in a CRM tracks lead volume by source and how many of those leads turn into deals. Pipedrive’s conversion reports track the leads-to-deals conversion rate by lead source, creator and time period, and its performance reports count leads created, archived and converted into deals over time.
That answers the question a small business asks about its marketing campaigns: which source deserves next month’s budget. Zoho CRM’s quadrant analysis goes one step further and plots the type of campaign against the revenue it generated.
Customer service dashboards
A service dashboard tracks how many cases arrive, how quickly the support team answers and closes them, and how satisfied customers are afterward. Bigin’s Multiple Bar target meter names tickets closed by agents as one of its uses, so even a small CRM can show a service target beside a sales one.
These views work only when tickets live in the CRM. If support runs through a separate help desk, the service dashboard belongs there, inside the customer service software that holds the tickets.
Executive dashboards
An executive dashboard shows an owner revenue against target, the forecast and where revenue came from, on one screen. HubSpot describes this leadership view as revenue attribution reports and forecasts.
Keep it to the numbers an owner acts on each month. A rep’s call count belongs on the rep’s screen, not here.
Each type names KPIs, and a KPI is comparable from month to month only when its formula is fixed.
CRM Dashboard KPIs and How to Calculate Each
The KPIs (key performance indicators) worth a place on a CRM dashboard are the ones with a fixed formula and a decision attached. Start with win rate: deals won divided by deals won plus deals lost, counted over the same period.
| KPI | Formula | Dashboard | Decision it drives |
|---|---|---|---|
| Win rate | Deals won / (deals won + deals lost), same period | Sales | Fix qualification or fix closing |
| Pipeline value | Sum of the amounts of all open deals | Sales | Whether there is enough pipeline to hit target |
| Weighted pipeline | Sum of each open deal’s amount x its stage probability | Sales, executive | What to forecast |
| Average deal size | Won revenue / number of won deals | Sales | Which deals deserve a rep’s time |
| Sales cycle length | Average days from deal created to deal won | Sales | When new deals will close |
| Lead-to-deal conversion rate | Leads converted to deals / leads created | Marketing | Which lead sources to fund |
| Activities per rep | Calls, emails and meetings logged / number of reps | Sales | Who needs coaching |
| Quota attainment | Closed-won revenue / quota for the period | Sales, executive | Whether targets or headcount need to change |
| MQL-to-SQL rate | Sales-qualified leads / marketing-qualified leads | Marketing | Whether marketing and sales agree on lead quality |
| Customer acquisition cost | Sales and marketing spend / new customers won | Marketing, executive | Whether growth is affordable |
| First response time | Average time from ticket created to first reply | Service | Staffing by hour and channel |
| Average resolution time | Average time from ticket created to ticket closed | Service | Where tickets get stuck |
| CSAT (customer satisfaction score) | Satisfied responses / total survey responses | Service | Which issues or agents need attention |
| Churn rate | Customers lost in the period / customers at the start of it | Executive | How much customer retention work is needed |
| Customer lifetime value | Average revenue per customer per period x average customer lifetime in periods | Executive | How much to spend to win a customer |
Pipedrive’s core measurable KPIs are the number of deals in the sales pipeline, win rates, average deal size and the average time to close. Three of those are rows above (win rate, average deal size and sales cycle length), and the fourth is a count of open deals. A sales manager who tracks only those four already covers volume, quality, value and speed.
Two rules keep the numbers honest. Fix one date range per KPI, and count the same records above and below the line. A win rate that divides this month’s wins by every deal ever created falls each month even when the team sells as well as before.
Here is an illustrative five-rep team with invented numbers, to run three of the formulas end to end. Last quarter the team closed 40 deals: 14 won and 26 lost. The 14 won deals brought in $84,000.
- Win rate: 14 / (14 + 26) = 35%
- Average deal size: $84,000 / 14 = $6,000
The same team’s open pipeline holds $60,000 of deals in a stage with a 20% probability, $40,000 in a 50% stage and $20,000 in an 80% stage. Pipeline value is $60,000 + $40,000 + $20,000 = $120,000. Weighted pipeline is $12,000 + $20,000 + $16,000 = $48,000.
Both belong on the screen: $120,000 is the work that is open, and $48,000 is the number to forecast from.
Real CRM Dashboard Examples From Vendor Documentation
The five examples below come from the vendors’ own listing, product and help pages, checked in November 2026: Salesforce, HubSpot, Pipedrive, Zoho CRM and Bigin.
Salesforce CRM Dashboards package
Salesforce’s CRM Dashboards package on AppExchange includes these dashboards and their source reports:
- Sales and marketing: Marketing Executive, Sales Executive, Sales Manager and Salesperson
- Customer service: Agent Supervisor Overview, Service Executive Overview and Service KPIs
Salesforce presents the set as a starting point for reporting.
HubSpot dashboard template library
HubSpot starts a new dashboard from a template. Its dashboard template library holds pre-built analytics dashboards for marketing, sales, revenue and service, and a drag-and-drop editor changes the layout.
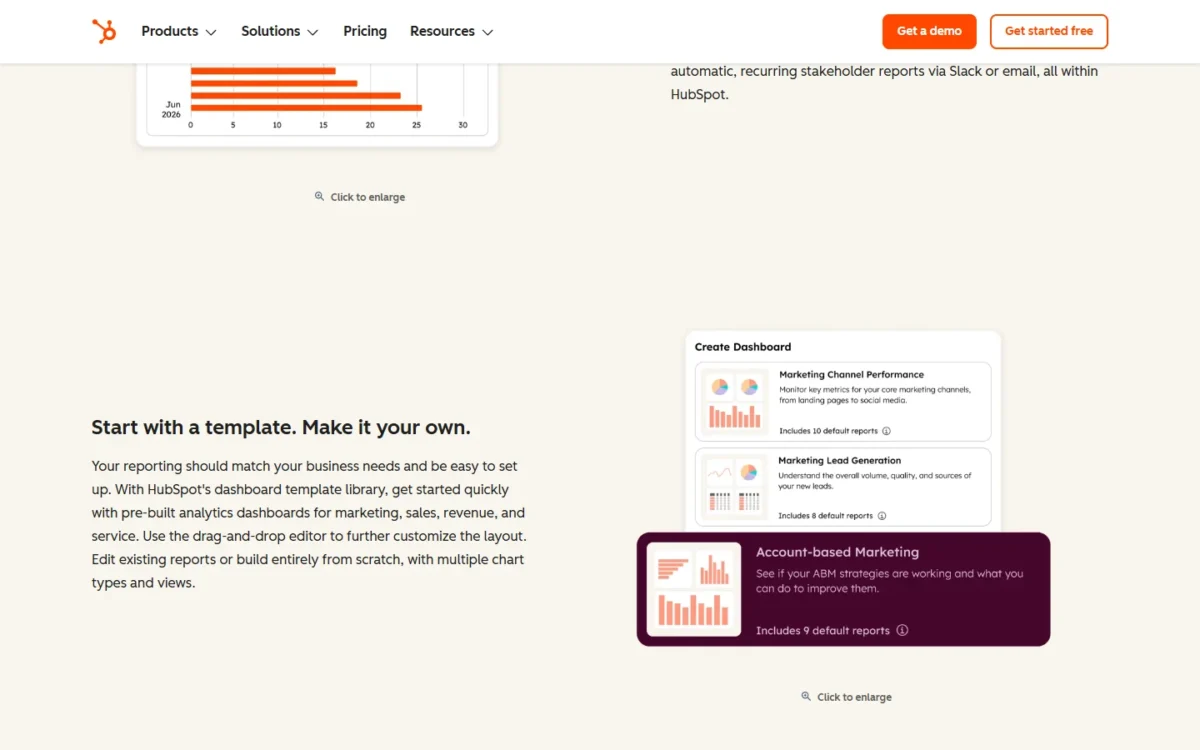
A template gives a small team a working dashboard before anyone learns the report builder. The trade-off is that it shows the vendor’s choice of KPIs, so check each chart against the formulas above.
Pipedrive Insights dashboards
A Pipedrive dashboard is a customized collection of Insights reports, at most 25, that the user drags in, resizes and rearranges. The report types include deal tracking, revenue forecasts, leads, performance, conversion, deal velocity and team performance.
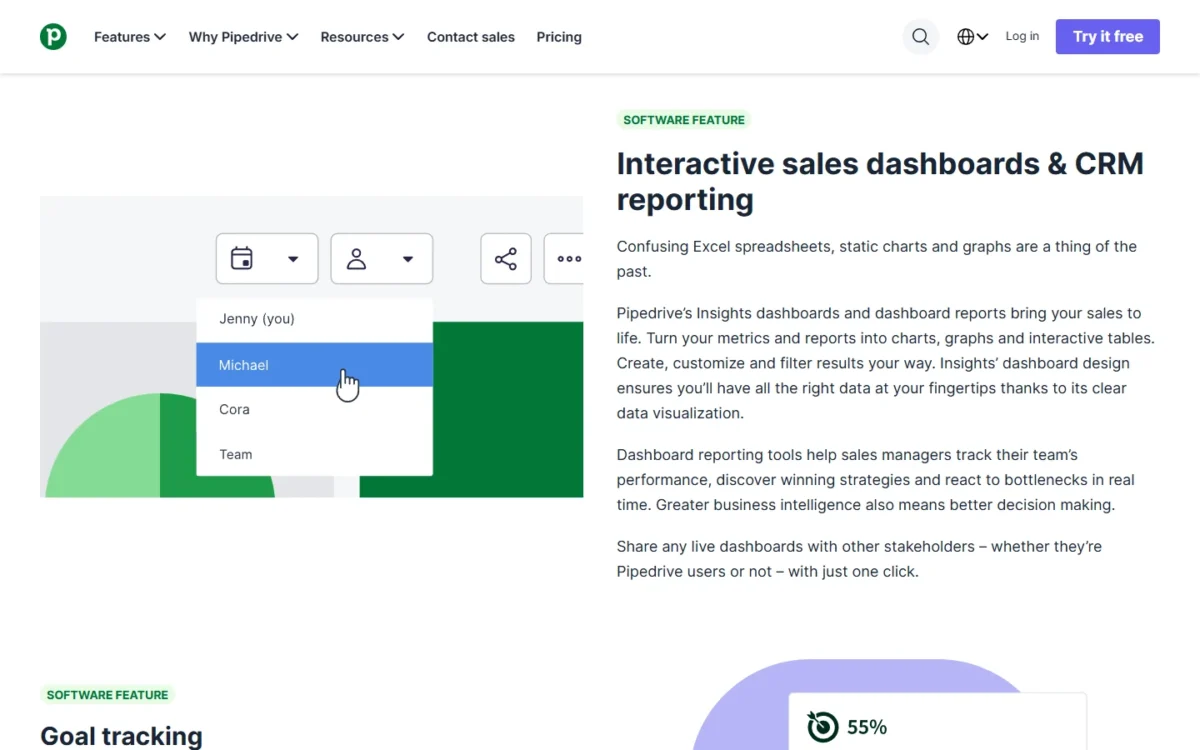
The user filter matters more than it looks. Only Premium and higher plans can create multiple dashboards, so on a lower plan the filter is how a manager reads one rep’s numbers and the team’s from the same board.
A finished dashboard can be shared with teammates, sent as a public link to people outside Pipedrive, or exported as a PDF or PNG.
Zoho CRM and Bigin dashboards
A Zoho CRM dashboard holds up to 20 components, and building one requires the Reports permission. Two component types go beyond charts: the Anomaly Detector flags a discrepancy in the usual business process, and the Target Meter sets and monitors a team target.
Bigin is the lighter build. Its target meters come in four styles, Dial Gauge, Traffic Light, Single Bar and Multiple Bar, and they are available only in the Premier, Bigin 360 and Zoho One editions. The Traffic Light meter colors progress red, orange or green against the target, so a small team reads quota without opening a report.
Benefits of a Dashboard, and Where It Misleads
A dashboard saves a manager the weekly work of gathering reports, but only when reps log their deals and activities in the CRM. Its numbers are only as current as that data and the last refresh.
What it changes:
- One shared view. A HubSpot dashboard combines multiple reports so each team member sees the data relevant to their role.
- From a number to its records. Drill-down in Zoho CRM and Bigin opens the records behind a chart or KPI, so a weak figure becomes a list of deals to discuss.
- Numbers on a schedule. A dashboard delivered by email or Slack reaches people who never open the CRM; step 8 below sets that up.
- Trends a list hides. A line chart of won revenue by month helps identify trends that a table of deals does not show.
Where it misleads:
- Unlogged work is invisible. A deal that lives in a rep’s inbox is missing from every chart, so data accuracy is a logging habit, not a dashboard feature.
- Filters hide without warning. Check the period and user filters before reading a drop as real.
- Shared links lag. A public link that updates hourly can show a deal as open after it has closed.
My take
Fix logging before layout. If reps do not record every deal and its stage, a clean dashboard reports a pipeline that does not exist.
I would hold the build until every open deal has an amount, a stage and a close date, then start with one sales dashboard.
If those conditions hold, the build itself is short.
How to Set Up a Dashboard in Your CRM
Setting up a CRM dashboard takes eight steps: name the decision, pick the KPIs, check the fields, build the reports, create the dashboard, set the filters, share it and schedule a review. A team with no CRM yet can practice the first three steps on a Google Sheets CRM template.
- Name the decision and the reader. Write one sentence: who reads this dashboard and what they decide from it. “A sales manager choosing which deals to review on Monday” is a dashboard. “Sales data” is not.
- Pick the KPIs and fix each formula. Choose the KPIs that feed that decision from the table above, each with one date range.
- Check that the fields exist and are filled. Win rate needs a won or lost status on every closed deal. Sales cycle length needs a created date and a won date.
- Build the reports. Make one report per KPI, since a dashboard only arranges reports that exist.
- Create the dashboard and add components. In Pipedrive, go to Insights, click “+” and choose Dashboard, then drag reports in from the left panel. In Bigin, open the Dashboards tab, click +New Dashboard, then + Component.
- Arrange it, then set filters and date ranges. My suggested order is overview figures on top, then the pipeline, then activities and follow-ups. Pipedrive’s move and resize icons and HubSpot’s drag-and-drop editor handle this customization.
- Share it and set permissions. HubSpot sets a dashboard to public, private or specific users and teams, and Bigin shares with Only me, All users or a custom list. For collaboration without accidental edits, HubSpot dashboards can be set to view-only for stakeholders.
- Schedule delivery and review it monthly. In HubSpot, schedule the dashboard as a recurring email digest (daily, weekly or monthly) or share it to Slack. At the monthly review, remove any chart nobody acted on. In Pipedrive, removing a report from a dashboard does not delete the report.
Before you share the dashboard
- Every KPI on the screen has a written formula and a date range
- Every chart opens the records behind it when clicked
- No saved filter hides a rep, a pipeline or a period by accident
- The viewer list matches who should see deal values
- The report and component counts sit inside your plan’s limits
That last check is where a build stops most abruptly, so look at the limits before you start.
Dashboard and report limits by CRM plan
Plan limits decide how many dashboards, reports and components you can build: Pipedrive, Zoho CRM and Bigin publish counts, and HubSpot gates reporting by edition.
| CRM | What is limited | Limit or plan gate |
|---|---|---|
| Pipedrive | Reports on one dashboard | Maximum 25 |
| Pipedrive | More than one dashboard | Premium and higher plans |
| Pipedrive | Insights reports per user | Lite 15, Growth 50, Premium 250, Ultimate 500 |
| Zoho CRM | Components on one dashboard | Maximum 20; building needs the Reports permission |
| Bigin | Custom dashboards | Paid editions only: Express 10, Premier 20, Bigin 360 50 |
| Bigin | Target meters | Premier, Bigin 360 and Zoho One editions |
| HubSpot | Standard dashboards and reports | Starter |
| HubSpot | Custom reports and advanced analytics | Professional |
| HubSpot | Multi-touch attribution, cross-object reports, Data Hub warehouse connections | Enterprise |
Sources: Pipedrive Insights dashboards, Pipedrive usage limits, Zoho CRM analytics components, Bigin dashboards, HubSpot dashboard and reporting software, checked Nov 2026.
Pipedrive’s limits bite in a specific order. A Lite user’s 15 Insights reports run out before one dashboard’s 25-report cap, and a second dashboard needs Premium, so a manager who wants separate rep and team boards is choosing a plan, not a layout.
Bigin gates by edition. Express includes custom dashboards, but target meters need Premier, Bigin 360 or Zoho One, so an Express team that wants a quota gauge pays for the edition, not for more dashboards.
Hitting a Pipedrive usage limit deletes nothing, but the account is blocked from manually adding more until someone frees up space, buys a top-up or upgrades. Pipedrive’s usage-limits page, last updated October 12, 2026, lists separate limits for accounts on its older plans.
HubSpot gates by depth rather than by count: custom reports arrive with Professional, and cross-object reports with Enterprise. Its reporting page does not publish a dashboard count per edition.
Do You Need a New CRM for Better Dashboards?
Usually not: most reporting gaps are a plan gate or a logging gap, not a reason to switch CRMs. Sort your own case with three rules.
- Stay on a spreadsheet if one to three people track a short list of deals. A template with a dashboard tab is enough at that size.
- Upgrade the plan if the blocker is a count or a gate: a second Pipedrive dashboard (Premium), custom dashboards in Bigin (a paid edition) or custom reports in HubSpot (Professional).
- Shortlist a new CRM only if the KPI you need cannot be built on any plan you would pay for, such as cross-object reports, which HubSpot lists under Enterprise, for a team that will not pay for Enterprise.
If a shortlist is the answer, compare CRM software by plan gates rather than by demo screens, because the same dashboard sits on a different plan at each vendor.
Price the upgrade before you ask for it, because what CRMs cost per user sets the size of the bill for one extra dashboard.
My take
I would pay for a higher plan only after the current dashboard is full and someone reads it every week. A team that has not used Pipedrive’s 15 reports on Lite will not get more from 50 on Growth.
Skip the upgrade if the real gap is missing deal data. No plan fixes that.
FAQ
What are the four types of dashboards in a CRM?
The four are sales, marketing, customer service and executive dashboards, split by who reads them. The types table above pairs each one with its reader, its question and its KPIs.
Can AI or ChatGPT create a CRM dashboard?
AI built into the CRM can create the reports a dashboard is made of. HubSpot’s Breeze Assistant builds a report from a plain-language description, using the account’s actual data. Pipedrive’s AI report creation generates a sales report from text input inside Insights, and Zoho CRM’s Zia suggests configurations for most analytics components. Arranging those reports into a dashboard, and checking each formula, is still the builder’s job.
What data in a CRM can a dashboard show?
A dashboard can show any record type the CRM can report on. In HubSpot, the custom report builder (custom reports arrive with Professional) analyzes contacts, companies, deals, tickets and custom objects in any combination. Customer interactions such as calls, emails and meetings appear only if reps log them.
Do you have to pay more for a CRM dashboard?
It depends on the CRM and the plan. HubSpot puts standard dashboards and reports on Starter and custom reports on Professional, Bigin limits custom dashboards to paid editions and Pipedrive keeps multiple dashboards for Premium and higher plans.