

Most broken Net Promoter Scores do not come from a broken formula. They come from an exported column that quietly contains a 99, three blank rows, and the same respondent twice.
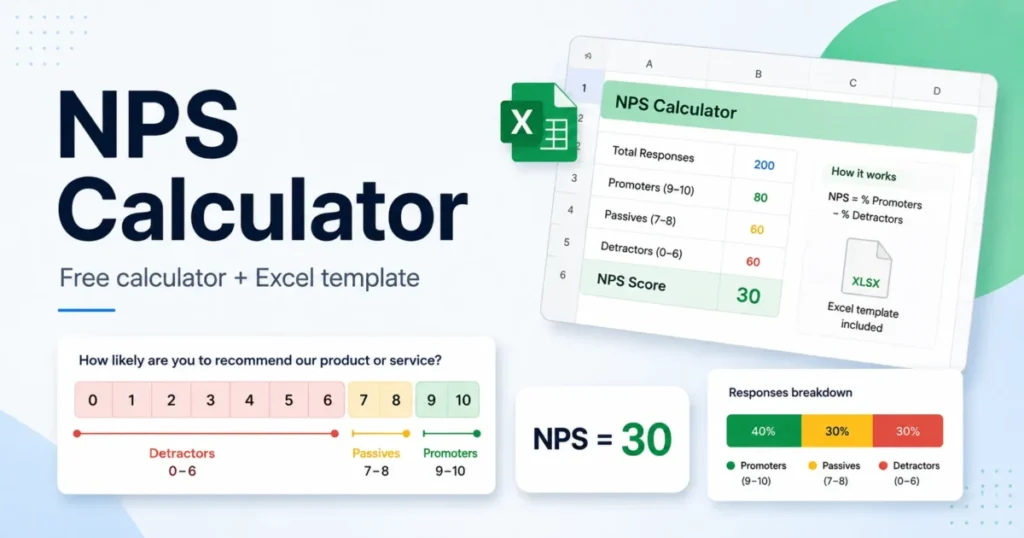
This free NPS calculator gives you three ways in. Paste a column of raw 0-10 ratings, enter how many people gave each rating, or type in the Promoter, Passive, and Detractor counts you already have.
Underneath sits the Excel template, the exact COUNTIF and COUNTIFS formulas behind it, the validation rules that catch bad input, and seven test cases you can run against your own copy before anyone sees the score.
In This Article (23 sections)
Free NPS Calculator
Paste the ratings or type the counts. The score, the response count, and the full category split appear together, because a Net Promoter Score without its denominator is not a reportable number.
Three inputs reach the same result. Pick the one that matches the shape of the data you were handed.
Raw scores. Paste every rating, one per line or separated by commas. Put a segment name after a comma on any line and the score is broken out per segment, each with its own denominator.
Score distribution. Enter how many people gave each rating, which is the shape most survey tools export.
Category counts. Enter the Promoter, Passive, and Detractor totals and it goes straight to the arithmetic.
All three run the identical formula, so they cannot disagree unless the categories were sorted wrong somewhere upstream. That is the first failure worth ruling out, and it is the reason raw scores are the safer input whenever the individual ratings still exist.
The calculator withholds the score while any value sits outside the whole numbers 0 to 10, and it reports how many it found. A spreadsheet cannot refuse like that, which is exactly why the Excel template further down carries a separate Invalid Scores cell.
It also returns a margin of error calculated from the response counts themselves, using the standard variance of the difference between two proportions. That figure is the quickest way to see that a score built on ten responses cannot be read the way a score built on two thousand can, and the exact expression is printed under the tool.
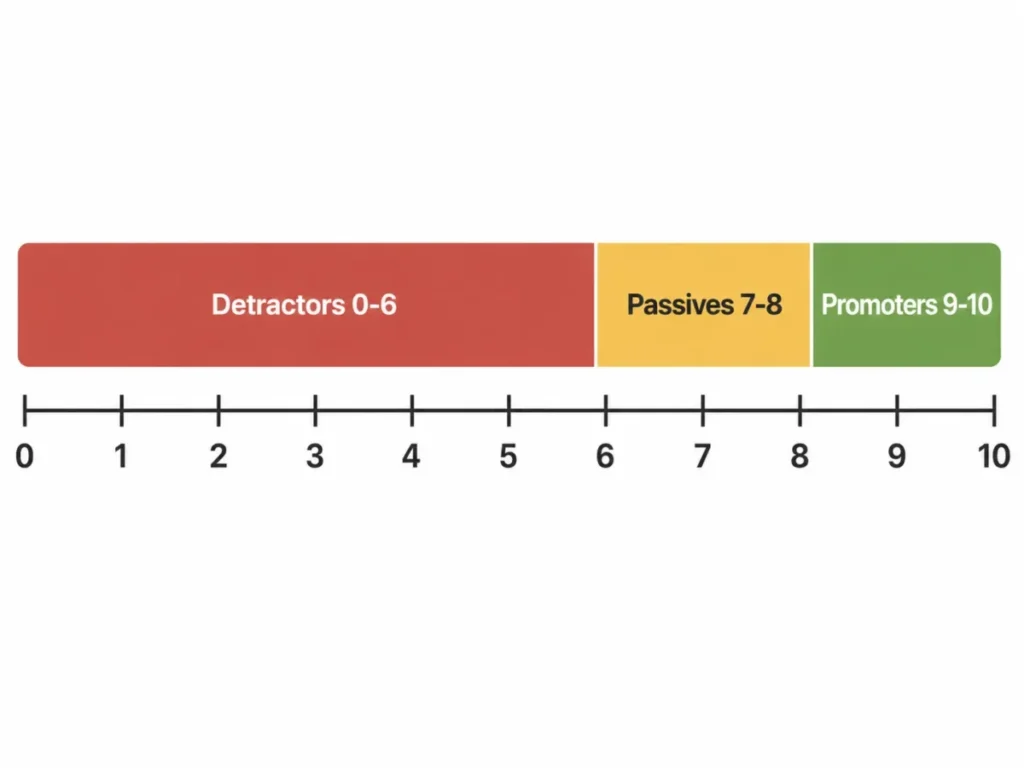
Bain's Net Promoter System documentation puts respondents who answer 9 or 10 in the Promoter group, 7 or 8 in the Passive group, and 0 to 6 in the Detractor group, and it scores the recommendation question on a zero-to-ten scale. Every input rule in this calculator follows those bands, and nothing else is treated as a valid standard NPS response.
Source: Bain Net Promoter System measurement documentation. Checked: 2026-08-09.
A result is only readable with its denominator attached, so the tool returns the whole picture rather than one headline number.
| Result field | What it reports | Why it stays visible |
|---|---|---|
| NPS Score | Promoter share minus Detractor share | The headline figure people quote |
| Total valid responses | Promoters plus Passives plus Detractors | Tells you how thin the sample is |
| Promoters / Passives / Detractors | The three category counts | Shows what moved the score |
| Category shares | Each category as a percentage of the total | Separates a Promoter gain from a Detractor drop |
| Invalid scores | Any value outside the response scale | Blocks the result until the data is clean |
| Margin of error | The range the score could sit in at the confidence level you pick | Stops a thin sample being read like a thick one |
| Rating distribution | How many people gave each rating on the scale | Shows whether the score turns on one band boundary |
| Segment breakdown | Every segment with its own denominator | Prevents one cohort borrowing another cohort's total |
Enter a previous-period score to get the change, and a target to see how many Detractors would have to convert to reach it. The summary copies as text, downloads as CSV, and turns into a shareable link that carries the numbers in the address itself, so nothing is stored anywhere.
If you are choosing survey tooling rather than fixing a spreadsheet, a dedicated feedback platform is a better starting point than a manual workbook.
Quick Copy: NPS Calculation Checklist
Copy these fourteen checks into your own doc and run them before the number leaves your team. Only check 11 ever shows up as a visible Excel error, so the rest fail quietly by design.
| # | Check | Pass condition |
|---|---|---|
| 1 | Question is a likelihood-to-recommend question | Wording asks how likely the respondent is to recommend |
| 2 | Response scale is 0 to 10 | No 1-5, 1-7, or 1-10 substitutes |
| 3 | One row per respondent | Duplicates removed before pasting |
| 4 | Blanks excluded | Non-responses are not counted as zeros |
| 5 | Promoters counted as 9 and 10 | Threshold is greater than or equal to 9 |
| 6 | Passives counted as 7 and 8 | Bounded range, not an open threshold |
| 7 | Detractors counted as 0 through 6 | Upper bound is 6 |
| 8 | Invalid scores equal zero | No numeric value below 0 or above 10 remains |
| 9 | Denominator includes Passives | Total equals all three category counts |
| 10 | Subtraction runs Promoters minus Detractors | Never the reverse |
| 11 | Empty dataset returns a blank result | No division attempt at zero responses |
| 12 | Category counts reconcile to the total | Sum matches the stated response count |
| 13 | Response count is published with the score | N appears wherever the score appears |
| 14 | Segment scores keep separate denominators | No borrowed totals between cohorts |
| Source: the score bands and the subtraction direction in this checklist follow the documented NPS category bands. Checked: 2026-08-09. |
Checks 2, 5, 6, 7, 9, and 10 are must-haves, and they map one to one onto the must-have criteria in the readiness matrix further down. Fail any one of them and the number is wrong rather than uncertain, so there is nothing to interpret.
How to Use This Checklist
The checklist is a six-move run, not a reading list. One person owns the run, and that person is whoever will be asked where the number came from.
The use case is always the same: turn a column of survey ratings into a number somebody will defend in a meeting. The required input is a set of ratings on the documented 0-10 recommendation scale, the example output is a score published beside its response count, and the most common error is a denominator that quietly lost its Passives.
Own it. Name the population and the period before you open the file, so the denominator is decided by a rule rather than by whatever rows survived the export.
Load it. Paste or enter the data, then read the Invalid scores field before anything else.
Score it. Rate the dataset against the weighted readiness matrix further down this page.
Reject or continue. A must-have failure stops the run regardless of the weighted total.
Prove it. Run the deterministic test cases against your copy of the workbook, not against the sample file.
Publish it. State the score with its response count, its period, and its population definition in the same sentence.
If a step cannot be completed, record which one and stop there. A partially audited score that gets shared anyway is the most common way a Net Promoter Score quietly loses credibility inside a company.
How to Calculate NPS
Bain describes the Net Promoter System as a system it created to help companies measure and manage customer loyalty, built on a single recommendation question rather than a battery of satisfaction items.
Source: Bain Net Promoter System overview. Checked: 2026-08-09.
The calculation itself is one subtraction. Bain's Net Promoter Score measurement page defines the score as the percentage of customers who are promoters minus the percentage who are detractors.
NPS = % Promoters − % Detractors
The result is a number between -100 and 100. It is not a percentage, even though two percentages produced it, and writing it with a percent sign is the fastest way to confuse a board deck.
The three categories
| Category | Score given | Role in the formula |
|---|---|---|
| Promoters | 9 or 10 | Added to the numerator |
| Passives | 7 or 8 | Counted in the denominator only |
| Detractors | 0 to 6 | Subtracted in the numerator |
| Source: Net Promoter Score category definitions. Checked: 2026-08-09. |
Why Passives still matter
Passives never move the numerator, which is why so many spreadsheets quietly drop them. Removing them from the denominator inflates both remaining shares and pushes the score away from zero in whichever direction the data already leaned.
Keep the denominator as Promoters plus Passives plus Detractors. That single rule prevents the most common arithmetic error on this page.
The count shortcut
Working from percentages means calculating two of them before you subtract. Working from counts skips a step and gives the same answer.
NPS = (Promoters − Detractors) ÷ Total valid responses × 100
The two forms are algebraically identical. I use the count form inside spreadsheets because it has one division instead of two, so there is one fewer place for a rounding artifact to appear.
Worked example one: 100 responses
A survey returns 55 Promoters, 20 Passives, and 25 Detractors. Total valid responses are 100, Promoter share is 55 percent, Detractor share is 25 percent, and the score is 30.
Because the denominator is exactly 100, this example is the fastest way to sanity-check any calculator you have been handed. If it returns anything other than 30, stop using it.
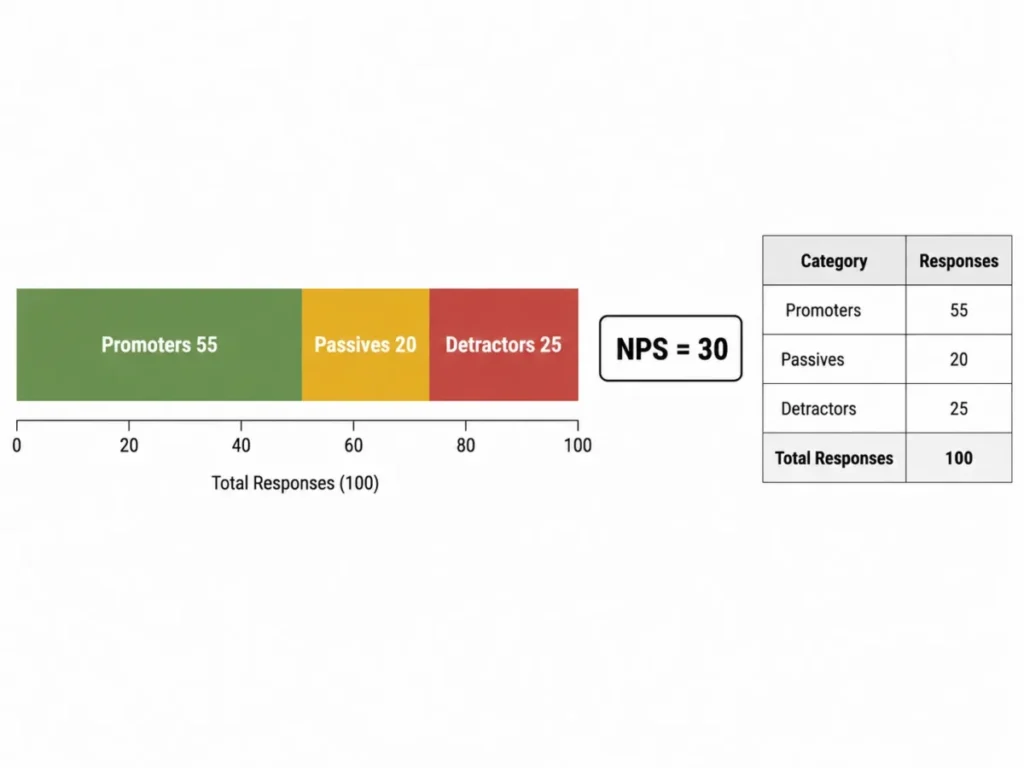
The same three counts also expose a reporting trap. A score of 30 built on 100 responses and a score of 30 built on 9 responses look identical in a slide and mean completely different things.
Worked example two: raw scores
Paste these ten ratings into a fresh sheet: 10, 9, 9, 8, 8, 7, 6, 5, 4, 10.
That set contains 4 Promoters, 3 Passives, and 3 Detractors across 10 responses. Promoters minus Detractors is 1, divided by 10 and multiplied by 100, which gives an NPS of 10.
Use this set as your first test vector whenever you copy formulas from an article, including this one. It exercises every band, including the 6 that belongs with the Detractors rather than the Passives.
Step 1: Define the Question, the Scale, and the Population
Fill this in before you touch the data. Half of the disputes about an NPS number turn out to be disputes about who was surveyed.
| Field | What to record | Example entry |
|---|---|---|
| Recommendation question | The exact wording used | Likelihood to recommend to a friend or colleague |
| Response scale | The scale presented to respondents | Standard zero-to-ten |
| Population | Who was eligible to answer | Active accounts with a support contact in the quarter |
| Period | Start and end dates of the collection window | Quarter to date |
| Unit of analysis | Company, product, team, or segment | Support team |
| Exclusions | Rows removed and why | Internal test accounts, duplicate submissions |
An entry of "everyone" in the population row is a warning sign rather than an answer. It usually means the export defined the population instead of the team.
Step 2: Separate Must-Have Inputs From Optional Fields
Not every column matters. These are the fields that decide whether the calculation is valid at all.
| Field | Must-have or optional | Consequence if missing |
|---|---|---|
| Numeric rating on the standard scale | Must-have | No standard NPS can be calculated |
| Respondent identifier | Must-have | Duplicates cannot be removed |
| Response date | Must-have | The period cannot be defended |
| Segment or account tag | Optional | Segment breakdowns become impossible |
| Free-text comment | Optional | Drivers stay unexplained |
| Survey channel | Optional | Channel bias stays invisible |
Reject rule. A missing must-have field stops the calculation. Do not substitute a proxy column, and do not backfill dates from the export timestamp.
Optional fields earn their place only if someone will act on them. Adding a column nobody reads is how a working template turns into an abandoned one within two quarters.
Step 3: Score Your Dataset With the Weighted Readiness Matrix
This matrix scores the dataset and the workbook together, because a clean formula over dirty data and a dirty formula over clean data fail in the same way. Score each criterion from 1 to 5, multiply by the weight, and add the results.
Each criterion carries its own evidence column, so every input traces to a visible cell in the workbook rather than to a memory of last quarter.
| Criterion | Weight | Scoring rule 1-5 | Evidence to point at |
|---|---|---|---|
| Scale integrity | 25% | 5 when every value is numeric and within 0-10 | Invalid scores cell |
| Category thresholds | 20% | 5 when the 9-10, 7-8, and 0-6 bands are exact | The three count formulas |
| Denominator completeness | 20% | 5 when the total equals all three counts | Total valid responses cell |
| Formula direction | 15% | 5 when Promoters minus Detractors is explicit | The score formula bar |
| Error handling | 10% | 5 when an empty sheet returns a blank | The sheet before any data |
| Result context | 10% | 5 when N and all counts publish with the score | The result card |
| The weights and scoring rules are an editorial framework. The band values they check against come from Bain's published NPS bands. Checked: 2026-08-09. |
The methodology behind this matrix is deliberately narrow. It scores reproducibility, not customer sentiment, so a high total means the number can be defended rather than that customers are happy.
Decision thresholds.
- 4.2 to 5.0: report the score.
- 3.5 to 4.1: fix the flagged criteria, then report.
- 3.0 to 3.4: share internally only, with the weakness named.
- Below 3.0: do not report, rebuild the workbook.
Scale integrity, category thresholds, denominator completeness, and formula direction are must-have criteria. A score of 1 or 2 on any of them rejects the dataset regardless of the weighted total.
Free NPS Excel Template
The template is one workbook with two sheets and no macros. Everything below is copyable, so you can rebuild it in an empty file instead of waiting for a download.
Microsoft documents COUNTIF as a statistical function that counts the cells in a range meeting a single criterion, and its criteria accept comparison expressions such as greater-than and less-than tests. COUNTIFS extends the same idea across multiple ranges and counts the rows where all the criteria are met, which is what a bounded 7-to-8 band needs.
Sources: Microsoft COUNTIF function documentation and Microsoft COUNTIFS function documentation. Checked: 2026-08-09.
The IF function makes a logical comparison and returns one value when the test is true and another when it is false, which is how the sheet stays blank instead of dividing by zero.
Source: Microsoft IF function documentation. Checked: 2026-08-09.
Sheet 1: Calculator
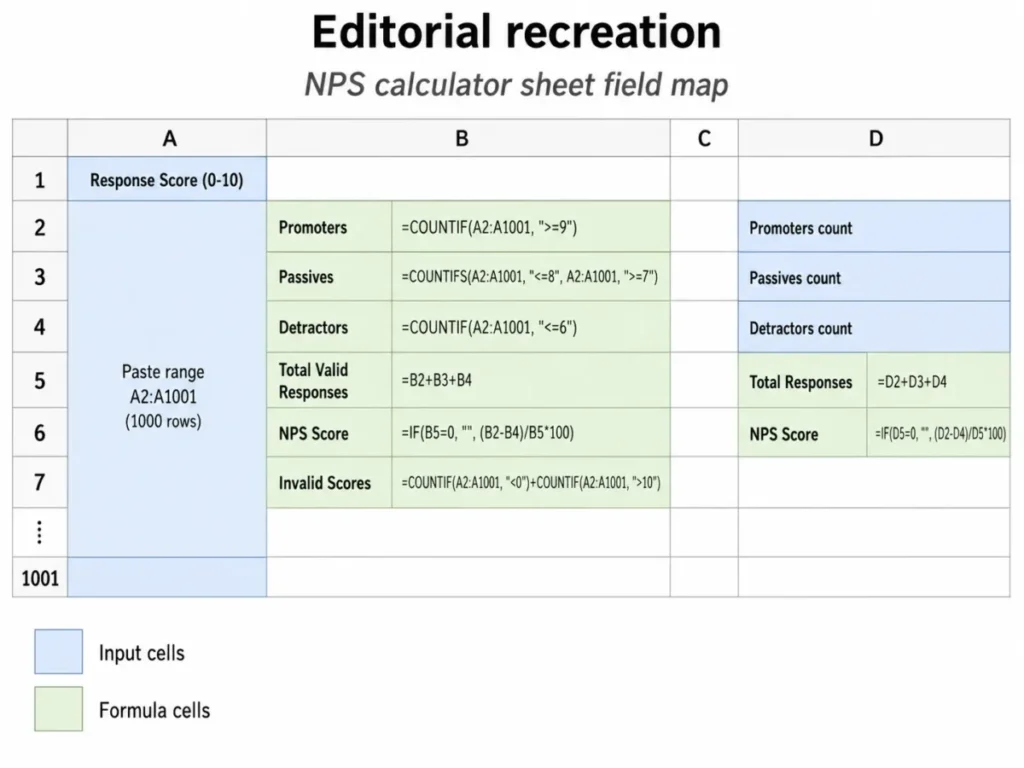
Column A holds the raw responses and column B holds the summary. Column D holds the pre-tallied alternative, so the two modes never share a cell.
| Cell | Field | Formula or input | Purpose |
|---|---|---|---|
| A1 | Response Score (0-10) | Header text | Labels the paste column |
| A2:A1001 | Raw NPS responses | Pasted numeric values | Holds one rating per row |
| B2 | Promoters | =COUNTIF(A2:A1001,">=9") | Counts 9 and 10 |
| B3 | Passives | =COUNTIFS(A2:A1001,"<=8",A2:A1001,">=7") | Counts the bounded 7-8 band |
| B4 | Detractors | =COUNTIF(A2:A1001,"<=6") | Counts 0 through 6, while values >10 are caught by B7 |
| B5 | Total Valid Responses | =B2+B3+B4 | Canonical denominator |
| B6 | NPS Score | =IF(B5=0,"",(B2-B4)/B5*100) | Score with an empty-state guard |
| B7 | Invalid Scores | =COUNTIF(A2:A1001,"<0")+COUNTIF(A2:A1001,">10") | Flags out-of-range values |
| D2 | Promoters count | Manual entry | Mode B input |
| D3 | Passives count | Manual entry | Mode B input |
| D4 | Detractors count | Manual entry | Mode B input |
| D5 | Total Responses | =D2+D3+D4 | Mode B denominator |
| D6 | NPS Score | =IF(D5=0,"",(D2-D4)/D5*100) | Mode B score |
| Single-criterion counting: the COUNTIF function reference. | |||
| Multi-criteria counting: the COUNTIFS function reference. |
Empty-state guard: the IF function reference. The thresholds inside these formulas follow Bain's documented NPS categories. Checked: 2026-08-09.
The one-thousand-row paste range is a template sizing choice, not an Excel constraint. Widen it if your export is longer, and widen every formula at the same time rather than one at a time.
Here is the same block as a copy-paste set for B2 through B7.
=COUNTIF(A2:A1001,">=9")
=COUNTIFS(A2:A1001,"<=8",A2:A1001,">=7")
=COUNTIF(A2:A1001,"<=6")
=B2+B3+B4
=IF(B5=0,"",(B2-B4)/B5*100)
=COUNTIF(A2:A1001,"<0")+COUNTIF(A2:A1001,">10")
Sheet 2: Example
Sheet 2 carries both worked examples and their expected outputs, which turns the workbook into something you can verify instead of something you have to trust. Keep it in the file after you start using the template, because it is the only part that tells a future colleague whether the formulas still work.
How to use the template with a survey export
Copy only the numeric rating column from your export, then paste values into A2. Pasting the whole export brings formatting and stray text that the threshold formulas will silently ignore.
Read B7 next. If Invalid Scores is anything other than zero, fix the source data before you look at B6.
Check that B5 matches the number of responses you expected for the period. A gap between the two usually means blanks or text entries, not a formula problem.
Then read B6 together with B2, B3, and B4. A score without its three counts is a number nobody can question, which sounds convenient until someone does.
Step 4: Validate the Raw Data Before You Trust the Score
Threshold formulas are not validation. A rating of 11 satisfies "greater than or equal to 9" and lands in the Promoter count without raising a single error, and a rating of -1 lands in the Detractor count the same way.
Apply numeric data validation to A2:A1001 with a whole-number rule between 0 and 10. That stops manual entry mistakes at the keyboard.
Keep the Invalid Scores cell anyway. Validation does not apply retroactively to pasted values, which is exactly how imported survey data gets in.
| Data problem | How it reaches the sheet | Detection | Fix |
|---|---|---|---|
| Value above the top of the scale | Rescaled or mis-mapped export column | Invalid Scores above zero | Correct at source, re-export |
| Negative value | Sentinel code for "no answer" | Invalid Scores above zero | Remove the rows, restate N |
| Blank rows | Partial survey completions | Total below expected response count | Exclude, do not treat as zero |
| Text such as "N/A" | Free-text field merged into the rating column | Total below expected response count | Strip before pasting |
| Duplicate respondents | Repeat submissions or a joined export | Respondent identifier count exceeds unique count | Deduplicate before pasting |
Blanks and text are the quieter of the five. Neither one raises an error and neither one inflates the score, but both shrink the denominator without telling you.
Step 5: Check Formulas, Ranges, and Error States
This is a pass or fail table. Anything that fails gets fixed before the score is read, not after.
| Check | Pass | Fail |
|---|---|---|
| Promoter threshold | Greater than or equal to 9 | Greater than 9, which drops every 9 |
| Passive band | Bounded between 7 and 8 | An open threshold that swallows 9 and 10 |
| Detractor threshold | Less than or equal to 6 | Less than 6, which drops every 6 |
| Ranges aligned | Every formula spans the identical rows | Mixed ranges across the three counts |
| Denominator source | Sum of the three counts | A separate manual response total |
| Empty-state guard | Blank result at zero responses | A division error on an empty sheet |
| External references | All ranges inside this workbook | Ranges pointing at another file |
| Source: the threshold values checked in this table follow Bain's NPS scoring bands. Checked: 2026-08-09. |
The threshold row is where copied formulas break most often. Writing greater-than 9 instead of greater-than-or-equal-to 9 silently reclassifies every 9 as a Passive and drags the score down without changing anything visible on screen.
Step 6: Test the Workbook With Known Datasets
Seven inputs with known outputs are enough to prove a copy of this template works. Run them in order and compare against the expected column.
| Test | Input | Expected result |
|---|---|---|
| Aggregate baseline | 55 Promoters, 20 Passives, 25 Detractors | NPS 30, total 100 |
| Raw baseline | 10, 9, 9, 8, 8, 7, 6, 5, 4, 10 | NPS 10, counts 4 / 3 / 3 |
| Upper boundary | Five ratings of 10 | NPS 100, total 5 |
| Lower boundary | Four ratings of 0 | NPS -100, total 4 |
| Passive-only | Six ratings split across 7 and 8 | NPS 0, total 6 |
| Decimal case | 4 Promoters, 2 Passives, 1 Detractor | NPS 42.9 to one decimal, total 7 |
| Empty and invalid | Empty sheet, then a single 11 | Blank result, then Invalid Scores of 1 |
| Every expected result above is calculated from the formula in Bain's NPS measurement guidance. Checked: 2026-08-09. |
The decimal case is the one people skip, and it is the one that starts arguments. The exact value is 42.857 to three decimals and it keeps repeating, so two teams rounding differently will report 42.9 and 43 from the same data.
Pick a display convention, write it next to the score, and keep it. The category thresholds and the formula are defined by the methodology, while the number of decimals you show is a house style decision.
Step 7: Decide Whether the Score Is Safe to Report
| Condition | Decision |
|---|---|
| All must-have criteria pass and Invalid Scores is zero | Report the score with N |
| Weighted total sits in the middle band | Fix the flagged criteria first |
| A must-have criterion fails | Do not report, rebuild |
| Invalid Scores above zero | Do not report until the source data is corrected |
| Response count below the period's usual volume | Report with the shortfall stated |
| Segments share a denominator | Split the denominators, then recalculate |
The last row catches a specific mistake. Once a team starts slicing NPS by segment, someone eventually divides one segment's numerator by the whole population's total, and the resulting score looks plausible enough to survive a review.
Example Filled-In NPS Checklist
This is an illustrative scenario, not a client case. A six-person customer success team at a B2B software company runs a quarterly in-app survey and collects 214 valid responses.
| Field | Entry |
|---|---|
| Population | Accounts with at least one logged session in the quarter |
| Period | One calendar quarter |
| Unit of analysis | Whole customer base |
| Promoters | 96 |
| Passives | 71 |
| Detractors | 47 |
| Total valid responses | 214 |
| Invalid Scores | 0 |
| NPS Score | 22.9 |
| The score is calculated from the counts in this table using the formula in Bain's NPS calculation guidance. Checked: 2026-08-09. |
Their readiness scores were 5 for scale integrity, 5 for category thresholds, 4 for denominator completeness, 5 for formula direction, 3 for error handling, and 4 for result context. Weighting those gives 5 × 0.25 = 1.25 for scale integrity, and the weighted total = 4.50.
That clears the 4.2 threshold, so the score is reportable. The 3 on error handling is still worth fixing, because a division error on an empty sheet gets pasted into a status update sooner or later.
My read on this dataset is that 214 responses will support a whole-base number and nothing finer. I would not publish a per-segment NPS from it until each segment carries its own defensible denominator.
Red Flags to Watch For
These are the signals that a Net Promoter Score should be paused rather than presented.
| Red flag | What it usually means |
|---|---|
| The score moved sharply with no change in response volume | Category thresholds were edited |
| The score is reported without a response count | The denominator will not survive a question |
| The three category counts do not sum to the stated total | Blanks or text are being counted somewhere |
| A five-point satisfaction survey is feeding the calculator | The metric is not standard NPS |
| Passives are missing from the summary | The denominator has been trimmed |
| The score is written with a percent sign | The output has been misunderstood as a share |
| Invalid Scores is hidden or deleted | The sheet cannot warn you any more |
| Different teams report different scores from one export | Denominators or periods differ silently |
| The workbook references a second file | The counts break when that file closes |
| Nobody can name the population | The score describes an unknown group |
Two of these are worth escalating immediately. A missing response count and a mismatched category sum both mean the number cannot be reproduced, and reproducibility is the only property that makes a tracked metric useful over time.
Common NPS Calculation Mistakes
Five mistakes account for most wrong scores, and none of them produce an Excel error.
Dropping Passives from the denominator. The score gets pushed away from zero in whichever direction the data already leaned. Keep the total as all three counts.
Reversing the subtraction. Detractors minus Promoters flips the sign, so a healthy 30 is reported as -30. Lock the formula direction as Promoters minus Detractors everywhere, including in the FAQ and the slide notes.
Trusting thresholds as validation. A greater-than-or-equal-to-9 test accepts 11, and a less-than-or-equal-to-6 test accepts -1. Add the range validation and the Invalid Scores counter, and treat any non-zero count as a stop.
Counting blanks as zeros. A blank is a non-response, while a zero is a very unhappy customer, and merging them manufactures Detractors. Exclude blanks and restate the response count instead.
Reporting the score without its context. A bare number invites the reader to assume the sample was large and the population was obvious. Publish the score, the response count, the period, and the population definition together.
How to Interpret Your NPS
The formula defines the mechanics and the range. A score of 100 means every respondent answered 9 or 10, a score of -100 means every respondent answered 6 or below, and 0 means the two groups cancelled out.
Source: Net Promoter Score calculation documentation. Checked: 2026-08-09.
What counts as a good score is a different question, and the measurement documentation checked for this article defines the calculation without publishing a universal good-or-excellent band. Treat any qualitative band you have seen as a third-party interpretation rather than part of the calculation method.
The comparison that survives scrutiny is your own trend on a stable population, a stable question, and a stable period. Change any one of those three and the trend line stops meaning what it looks like it means.
I would also resist reading a single-point movement as a signal. On 214 responses, a handful of Detractors converting to Passives moves the number without changing anything about the business.
Using NPS by Segment
The measurement documentation describes tracking the score not only for a whole company but for each business, product, store, or customer-service team, and for customer segments, geographic units, and functional groups.
Source: Net Promoter Score tracking levels. Checked: 2026-08-09.
The formula does not change when you slice it. What changes is the denominator, and every segment needs its own.
The calculator at the top of this page does the same split when you put a segment name after each rating, which is the fastest way to sanity-check a cohort before you build it in the workbook.
Duplicate the Calculator sheet once per segment rather than adding columns to one sheet. Separate sheets make it obvious that each score has its own N, and they stop a stray range from spanning two cohorts.
Two practical limits apply. Segments get small quickly, and a segment score built on a dozen responses will swing on individual answers, so I would publish the count beside every segment score or not publish the segment at all.
When Not to Use This NPS Template
Your survey uses a 1-5 or 1-7 scale. The category bands in this template are defined against a 0-10 recommendation question, and remapping a different scale into them produces a metric that is not standard NPS. Score it with its own defined method and give it its own name.
Your rating column cannot be cleaned. If out-of-range values exist and the source cannot be corrected, the dataset is not ready for any threshold-based calculation.
You need collection, routing, and dashboards. This is a calculation asset, not a survey platform, and it does nothing about distribution, reminders, respondent identity, or text analysis. Tools such as those covered in the Survicate survey platform review sit in that category instead.
You want a workbook that pulls from a closed file. Keep the template self-contained for the reason set out in the troubleshooting section below.
Troubleshooting Common Excel Errors
Microsoft documents a specific failure where a COUNTIF formula returns a #VALUE! error because it refers to cells or a range in a closed workbook, and the fix is to open the other workbook.
Source: Microsoft COUNTIF troubleshooting documentation. Checked: 2026-08-09.
That is the argument for keeping the raw responses in the same file as the formulas. A self-contained workbook cannot break because someone closed a file on a shared drive.
| Symptom | Likely cause | Fix |
|---|---|---|
| #VALUE! in a count cell | The range points at a closed workbook | Move the data into this file |
| Blank NPS cell | Total valid responses is zero | Expected behavior, add data |
| Counts stay at zero with data present | Ratings pasted as text | Convert the column to numbers |
| Total is lower than the response count | Blanks or text in the range | Clean the column, restate N |
| Score changes when a row is added | The formula range stops short | Extend every range together |
| Score shows as a percentage | The cell carries percent formatting | Set the cell to a plain number |
The text-formatted column is the one that wastes the most time. Every count returns zero, the sheet looks broken, and the formulas are fine.
What to Do After You Have Your Score
If the score is reportable and the trend is flat. Move the effort to the comments rather than the number, because the metric has told you what it can.
If Detractors are concentrated in support interactions. Look at response handling and coverage before you look at the product roadmap, and the customer service software options round-up is the relevant shortlist.
If you cannot tie responses back to accounts. The gap is record-keeping rather than surveying, and CRM software explained covers what that system is supposed to hold.
If the workbook is becoming your reporting system. That is the point to stop extending it, and the CRM Excel template shows where a spreadsheet stops being enough.
Methodology and Sources
This guide is built on primary documentation. The Net Promoter System pages published by Bain & Company supply the recommendation question, the response scale, the category bands, and the score formula, checked on 2026-08-09.
The Excel behavior comes from Microsoft Support function references for COUNTIF, COUNTIFS, and IF, checked on the same date. Those pages define what each function counts and how its criteria are written.
The template was assessed against the same criteria the readiness matrix publishes: scale integrity, category thresholds, denominator completeness, formula direction, error handling, and result context.
Greater weight went to the checks that change a reported number rather than the ones that change formatting. Claims that could not be traced to those sources were excluded, and every spreadsheet design choice is labelled as an editorial recommendation.
Related Resources
A spreadsheet-first workflow tends to sit next to other spreadsheet-first workflows, so these are the adjacent assets worth having open.
- The Google Sheets CRM template for teams that would rather stay out of Excel.
- The small business CRM picks for teams whose response data has outgrown a workbook.
FAQ
What is the formula for NPS?
NPS is the percentage of Promoters minus the percentage of Detractors, which gives a number between -100 and 100. The count form, Promoters minus Detractors divided by total valid responses times 100, returns the identical answer with one division instead of two.
How do you calculate NPS from raw survey scores?
Sort every 0-10 rating into three groups: 9 and 10 are Promoters, 7 and 8 are Passives, and 0 through 6 are Detractors. Then subtract the Detractor share from the Promoter share, keeping all three groups in the denominator.
How do I calculate NPS in Excel?
Use COUNTIF with a greater-than-or-equal-to-9 criterion for Promoters and a less-than-or-equal-to-6 criterion for Detractors, and COUNTIFS with a bounded 7-to-8 pair for Passives. Set the total to the sum of the three counts, then wrap the score in an IF that returns a blank while the total is zero.
Do Passives count in the NPS calculation?
Yes, in the denominator. Their share is never added to or subtracted from the numerator, but removing them from the total inflates the other two shares and moves the score.
Is NPS a percentage?
No. Two percentages produce it, but the result is an index between -100 and 100, so a percent sign next to it is wrong.
Can an NPS score be negative?
Yes. Any dataset with more Detractors than Promoters returns a negative number, and a set where every respondent scores 6 or below returns -100.
What should the spreadsheet show before any responses arrive?
A blank, not an error. Wrapping the calculation in an IF that checks whether the total is zero keeps the empty workbook readable instead of filling it with division errors.
Can I use a 1-5 satisfaction survey in this NPS calculator?
Not as standard NPS. The bands in this template are defined against a 0-10 recommendation question, so remapping a 1-5 scale into them produces a different metric that needs its own name and its own documented method.
How do I calculate NPS for separate customer segments?
Duplicate the Calculator sheet for each segment and give each one its own response set. The formula is unchanged, but every segment must keep its own denominator and publish its own response count.
What is a good NPS score?
The measurement documentation checked for this article defines the calculation without publishing a universal good-or-excellent band, so any threshold you have seen comes from a vendor or a panel rather than the method itself. The defensible comparison is your own trend on a stable question, population, and period.