
A customer lifetime value calculator only helps if it runs the formula your business model can support. Most CLV tools ask for an average order value, a purchase frequency, and a lifespan, then hand back one number with no label on whether that number is revenue or profit.
That single unlabeled figure is where budget decisions go wrong. A revenue result compared against acquisition cost looks healthier than the contribution a finance team can spend.
This page gives you a copyable calculator checklist, a model selector, the documented formulas for repeat-purchase and subscription businesses, two worked examples, validation rules, a segment worksheet, and a free spreadsheet layout you can rebuild in Excel or Google Sheets. If you track customers in a CRM, the input definitions below match the fields most systems already expose, and the CRM software fundamentals primer covers where those fields live.
In This Article (23 sections)
Customer lifetime value calculator
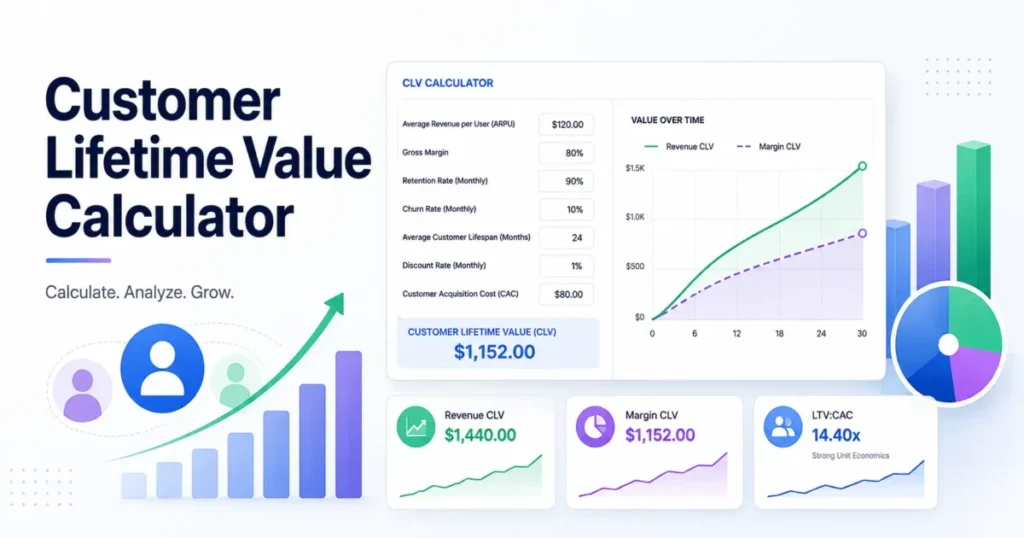
Enter your own numbers and the results update as you type. Lifetime revenue and margin-adjusted value are two different figures, so the tool keeps them apart.
Formulas follow published documentation from Shopify, HubSpot and Twilio. Nothing you enter is stored or sent anywhere.
Quick-Start CLV Checklist (Copy This Before You Calculate)
Work through this list before you type a single number into any customer lifetime value calculator. Every row prevents a specific error that changes the result.
| # | Check | Done when |
|---|---|---|
| 1 | Business model selected | You picked repeat purchase, subscription, or discounted cash flow |
| 2 | Analysis period fixed | Start and end dates written down, not implied |
| 3 | Customer definition written | One deduplication rule for email, account, or device |
| 4 | Revenue basis declared | Gross sales, or net of refunds, returns, and discounts |
| 5 | Average purchase value pulled | Revenue in the period divided by purchases in the same period |
| 6 | Purchase frequency pulled | Purchases divided by unique customers in the same period |
| 7 | Customer lifespan evidenced | Taken from relationship history, not invented to fill a field |
| 8 | Time units matched | Frequency, churn, and lifespan share one time basis |
| 9 | Churn basis labelled | Customer churn or revenue churn, never a generic churn field |
| 10 | Gross margin sourced | Finance definition, consistent with the revenue basis above |
| 11 | Cost to serve considered | Onboarding, support, and fulfillment noted even if excluded |
| 12 | Acquisition cost scoped | You know which spend and salaries are inside the number |
| 13 | Segment named | Channel, cohort, tier, or geography recorded on the sheet |
| 14 | Assumptions saved | Calculation date and every input basis stored for reuse |
Shopify’s guidance sets the three inputs the basic model depends on: average purchase value, purchase frequency, and average customer lifespan, as documented in Shopify’s customer lifetime value analysis guide.
How to Use This Customer Lifetime Value Calculator
The order matters more than the arithmetic. Run these seven steps once for a company baseline, then repeat them per segment.
Start from the use case, because the decision you are funding determines which required input you have to source and which template tab you fill. Apply the model that matches your data, customize the worksheet to your own segments, then read the example output below before you trust your own numbers.
If the documented formula for your model needs an input you cannot evidence, that is the common error to stop on rather than estimate around.
- Pick the model first. Repeat purchase, subscription, and discounted cash flow answer related but different questions.
- Fix the population and the period. One customer definition, one date range, one currency.
- Pull revenue behavior before costs. Get purchase value, frequency, and lifespan (or ARPA and churn) from the same period.
- Add margin only when profitability is the decision. Without margin, the output stays a revenue figure.
- Validate units and boundaries. Reject mismatched periods and zero churn before you calculate.
- Read two outputs, not one. Revenue CLV and margin CLV are separate results.
- Repeat by segment, then record assumptions. A company average hides the channel that is losing money.
The owner of the calculation should be whoever owns the revenue data, usually RevOps or finance. If a required input fails the readiness scoring further down, the correct action is to fix the data, not to guess the number.
Step 1: Define the Goal, the Customer, and the Period
Write the decision first. “Should paid social keep its budget next quarter” produces a different worksheet than “what is the blended lifetime revenue figure for the board deck.”
| Field | What to enter | Why the field exists |
|---|---|---|
| Business problem | The decision this number will support | Stops the metric becoming a vanity figure |
| Target outcome | Budget shift, retention investment, or forecast | Sets the precision you need |
| Team and owner | Person accountable for the inputs | Prevents three versions of the same number |
| Customer definition | The deduplication rule you will reuse | Guest checkouts and multiple emails inflate counts |
| Data start and end date | Exact source period | Makes the result reproducible next quarter |
| Currency | One currency for every monetary field | Mixed currency silently distorts averages |
| Segment | Channel, cohort, tier, or geography | Averages hide acquisition quality differences |
| Deadline | When the decision gets made | Controls how deep a model you can justify |
Customer identity deserves more attention than it usually gets. Google documents that lifetime analysis in GA4 shifts with the reporting identity in use. “By User-ID, then device” prioritizes verified user identification, while “By device only” relies on client or app-instance IDs, per the GA4 User lifetime documentation.
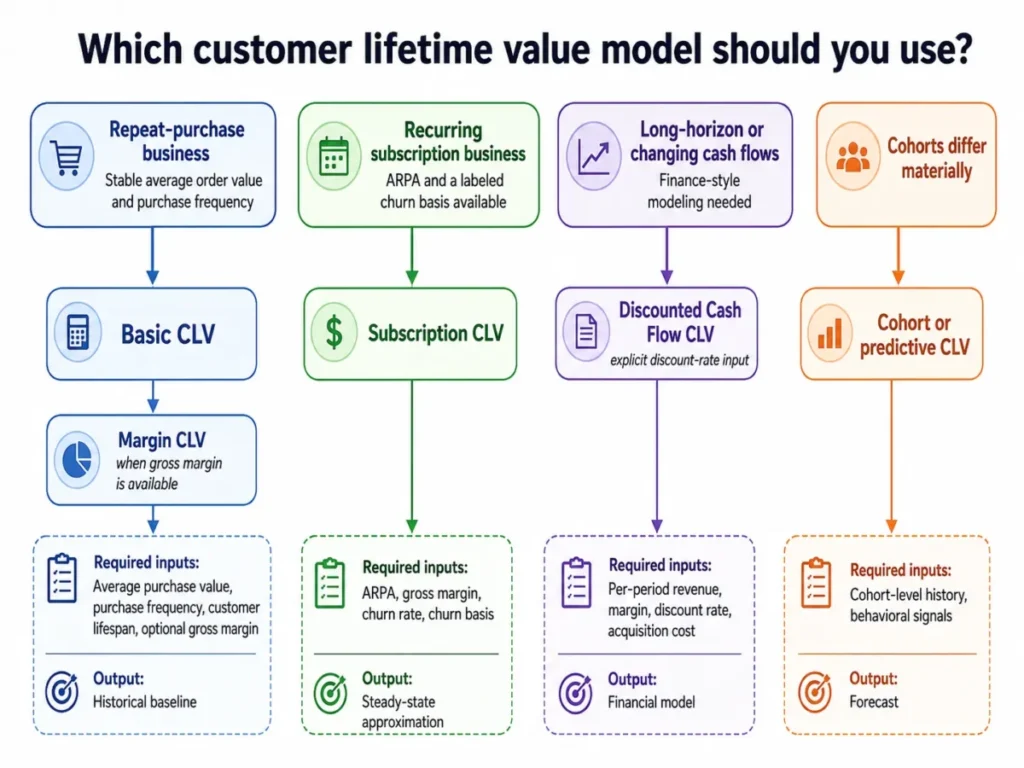
Step 2: Choose Your CLV Formula Before You Enter Numbers
This is the step almost every calculator skips. Entering numbers into the wrong model produces a mathematically valid result that points at the wrong decision.
| If your business looks like this | Use this model | You need these inputs | Treat the output as |
|---|---|---|---|
| Repeat purchase, stable order patterns, no contract | Basic or margin CLV | Average purchase value, purchase frequency, lifespan, optional margin | A historical baseline |
| Recurring subscription with billing data | Subscription CLV | ARPA, gross margin, churn rate on a labelled basis | A steady-state approximation |
| Long horizon, changing cash flows, finance review | Discounted cash flow CLV | Per-period revenue, margin, discount rate, acquisition cost | A financial model, not a metric |
| Diverse cohorts or non-linear buying | Cohort or predictive CLV | Cohort-level history, behavioral signals | A forecast that needs validation |
Mailchimp documents predictive, cohort-based, gross margin, and discounted cash flow as the advanced models that sit beyond the basic formula, in its guide on how to calculate customer lifetime value.
Customer Lifetime Value Formulas and What Each One Answers
Keep each formula self-contained. Splicing a retention factor into a lifespan that was already derived from churn counts the same effect twice.
| Model | Formula | Output label |
|---|---|---|
| Basic repeat purchase | Average purchase value × Purchase frequency × Customer lifespan | Revenue CLV |
| Margin adjusted | (Average purchase value × Purchase frequency × Customer lifespan) × Profit margin | Margin CLV |
| Subscription | (ARPA × Gross margin %) ÷ Revenue churn rate | Margin LTV, steady state |
| Cost aware | (Average revenue per customer × Customer lifespan) − Total costs to serve | Net customer value |
| Discounted cash flow | Sum of [(Revenue per period × Gross margin) ÷ (1 + Discount rate)^period] − Acquisition cost | Present value of a customer |
- Formula source: Twilio CLV formula reference, checked 2026-08-09.
Twilio documents the basic, profit-margin, subscription, and discount-rate variants together, including the subscription form built from average revenue per account, gross margin percentage, and revenue churn rate.
Salesforce frames the cost-aware version differently, subtracting total costs to serve from revenue across the relationship, in its guide to customer lifetime value. The difference between those two framings is not academic.
One tells you what a customer paid you, the other tells you what the customer left behind after you served them.
Step 3: Pull Each Input From the Right System
Formula pages define the inputs. Very few of them tell you which system to open, which is where most spreadsheets start drifting.
| Input | Definition to use | Source system |
|---|---|---|
| Average purchase value | Total revenue in a period divided by purchases in that period | Orders or billing report |
| Purchase frequency | Purchases divided by unique customers in that period | Orders report joined to the customer table |
| Average customer lifespan | Average active relationship duration, or one divided by churn rate | CRM relationship history |
| ARPA | Recurring revenue divided by active accounts | Billing or subscription system |
| Churn rate | Customers lost, or recurring revenue lost, over the same period | Billing system, labelled by basis |
| Gross margin | Revenue minus cost of goods sold, divided by revenue | Finance, not marketing |
| Acquisition cost | Sales and marketing spend divided by new customers won | Finance plus advertising platforms |
HubSpot’s decomposition is the one to copy for the transactional side, as set out in its customer lifetime value calculation guide. Average purchase value comes from total revenue divided by purchase count, purchase frequency from purchases divided by unique customers, and customer value from purchase value multiplied by average lifespan. That same guide notes that teams without years of history can estimate customer lifespan by dividing one by their churn rate percentage.
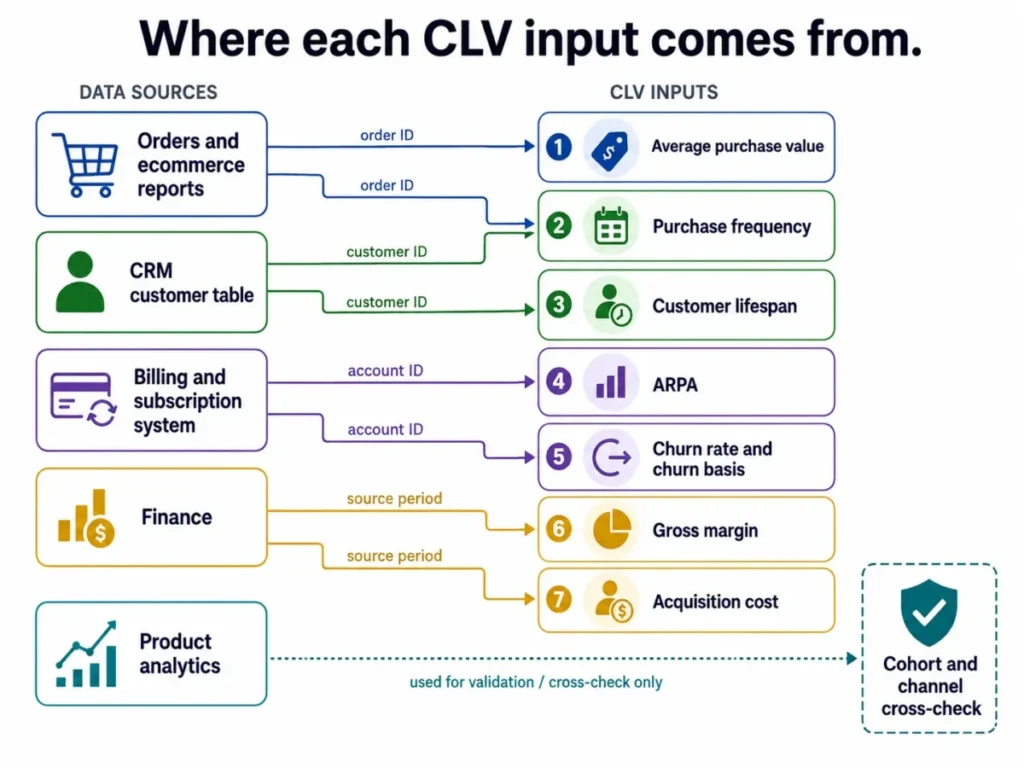
Analytics lifetime revenue and a modelled CLV will rarely agree, and that is expected. Google’s User lifetime data scope covers users active after August 15th, 2020, samples up to 1 million users on the free version, and fixes the exploration end date to yesterday. The population and the window therefore differ from a spreadsheet you control.
Step 4: Separate Must-Have Inputs From Optional Ones
A missing must-have input is a stop condition. Filling it with a plausible guess is how a CLV number becomes unfalsifiable.
| Input | Repeat purchase | Subscription | If missing |
|---|---|---|---|
| Average purchase value | Must have | Not used | Stop and pull the orders report |
| Purchase frequency | Must have | Not used | Stop and fix the customer count |
| Customer lifespan | Must have | Derived from churn | Estimate from churn and label it as derived |
| ARPA | Not used | Must have | Stop and open the billing system |
| Churn rate and basis | Optional | Must have | Stop; a generic churn field is not usable |
| Gross margin | Nice to have | Must have | Report revenue CLV only and say so |
| Acquisition cost | Nice to have | Nice to have | Skip the ratio, keep the CLV |
| Cost to serve | Nice to have | Nice to have | Note the omission on the sheet |
| Segment label | Nice to have | Nice to have | Keep the result as a blended average |
Salesforce is explicit that revenue only tells part of the story, per its factors that impact customer lifetime value. What it takes to win, onboard, and support a customer belongs in the assessment.
If those costs are material in your business and you leave them out, the honest label for your output is revenue, not value.
Step 5: Score Whether Your Inputs Are Decision-Grade
Most calculators return a number regardless of input quality. This weighted matrix decides whether the number deserves to move budget, and it is the step to keep on a first run.
Score each criterion from 1 to 5, multiply by the weight, and total the weighted column. The methodology is deliberately blunt: criteria are weighted by how much damage a bad input does to the final figure, and every score has to point at evidence you can open.
| Criterion | Weight | Score 1 to 5 | Evidence you must be able to show | Weighted score |
|---|---|---|---|---|
| Period consistency | 25% | Same date range on every rate and revenue field | 25% × score | |
| Customer identity | 20% | One written deduplication rule applied across periods | 20% × score | |
| Lifespan or churn quality | 20% | Relationship history or a churn export, not an estimate | 20% × score | |
| Revenue basis | 15% | Statement of gross or net of refunds and discounts | 15% × score | |
| Margin definition | 10% | Finance definition matching the revenue basis | 10% × score | |
| Segment coverage | 10% | At least one segment split beyond the blended average | 10% × score |
These criteria track the failure modes Mailchimp names in its list of common customer lifetime value mistakes, including incorrect customer segmentation and choosing an unrealistic number for a customer’s lifetime.
Worked example of the calculation: a sheet scoring 5, 4, 3, 4, 4, 2 produces 1.25 + 0.8 + 0.6 + 0.6 + 0.4 + 0.2 = 3.85.
Decision thresholds, applied to the weighted total:
- 4.2 and above: use the result for budget allocation.
- 3.5 to 4.1: use it directionally, then fix the weakest criterion before the next review.
- 3.0 to 3.4: use it only for internal comparison between segments.
- Below 3.0: recalculate after fixing the data.
- Any must-have input scored 1: reject the result regardless of the total.
Step 6: Check Costs, Margin, and Hidden Deductions
Gross margin is the headline deduction, and it is rarely the only one. This is the section where a healthy looking CLV usually loses weight.
| Cost check | Question to answer | Effect if ignored |
|---|---|---|
| Cost of goods sold | Is COGS inside your margin figure already | Double counting or omission |
| Refunds and returns | Is revenue gross or net of them | Overstated purchase value |
| Discounts and promotions | Are discounted orders in the average | Overstated purchase value |
| Payment and platform fees | Are they in COGS or below the line | Inconsistent margin basis |
| Fulfillment and shipping | Recovered from the customer or absorbed | Overstated contribution |
| Onboarding and implementation | One time cost per new account | Overstated early-life value |
| Support and success cost | Cost of serving a high-touch account | Overstated value on your largest accounts |
| Acquisition cost scope | Which salaries, tools, and media are inside CAC | Ratio that cannot be compared to anyone else’s |
Mailchimp lists reducing cost to serve among the ways to improve customer lifetime value, alongside retention and order value, which is a reminder that the denominator of your unit economics is as adjustable as the numerator.
Two rules keep this section honest. Use one revenue basis for the whole worksheet, and make the margin definition match it.
Step 7: Validate the Calculation Before You Trust It
Run these checks in order. Each one has stopped a real spreadsheet from shipping a wrong number.
- Period consistency. Monthly ARPA with annual churn, or annual frequency with a monthly lifespan, changes the answer by an order of magnitude. Normalize to one basis before dividing.
- Zero churn. The subscription formula divides by churn, so a zero churn entry has no defined result. Reject the input rather than displaying an infinite value.
- Very low churn. Below roughly 1% per month, small denominator changes swing the output hard. Switch to a finite forecast horizon or a cohort model.
- Churn basis. Customer churn and revenue churn are not interchangeable. The subscription formula above is the revenue churn form, so label the field.
- Margin bounds. A gross margin above 100% in a basic template means the margin and revenue bases disagree.
- Negative inputs. No monetary field in one formula run should be negative.
- Double counted retention. If lifespan came from one divided by churn, do not multiply by a retention rate as well.
- Discount rate. There is no default that fits every company, so a discounted cash flow run needs a rate supplied by your own finance team.
- Refund treatment. Revenue and margin must treat refunds the same way.
- Segment consistency. The same customer definition must apply to every segment you compare.
Your CLV Results: Revenue CLV, Margin CLV, and Value After CAC
Read three outputs, and never let them collapse into one headline. Revenue CLV is lifetime revenue, margin CLV is lifetime contribution, and margin CLV minus acquisition cost is what is left to fund everything else.
What a baseline CLV supports: comparing segments calculated on the same basis, setting an acquisition ceiling, and sizing a retention investment.
What it does not prove: what any individual customer will spend, that past behavior will continue, or that a channel is profitable when only revenue was measured.
Shopify is direct that the simple model uses historical business data to calculate a flat average and assumes the future will look exactly like the past, in its description of the simple CLV model. That is a fair description of what the calculator above produces, which is why the correct label is historical baseline rather than prediction.
Starter Template: Worked Ecommerce CLV Example
The example output below is an editorial teaching set, built to show formula behavior rather than to report any company’s results. The point is the gap between the two labelled outputs.
| Input | Value |
|---|---|
| Average order value | $80 |
| Purchase frequency | 4 orders per year |
| Customer lifespan | 3 years |
| Gross margin | 45% |
| Customer acquisition cost | $120 |
- Formula source: basic and profit-margin CLV variants documented by Twilio, checked 2026-08-09.
Revenue CLV runs the documented basic formula: 80 × 4 × 3 = 960. Margin CLV applies the documented profit-margin variant: 960 × 0.45 = 432.
Against a $120 acquisition cost, margin CLV leaves $312 per customer and a ratio of 3.6 to 1 on the margin basis. Run the same ratio on revenue and it reads 8 to 1, which is the exact overstatement this page exists to prevent.
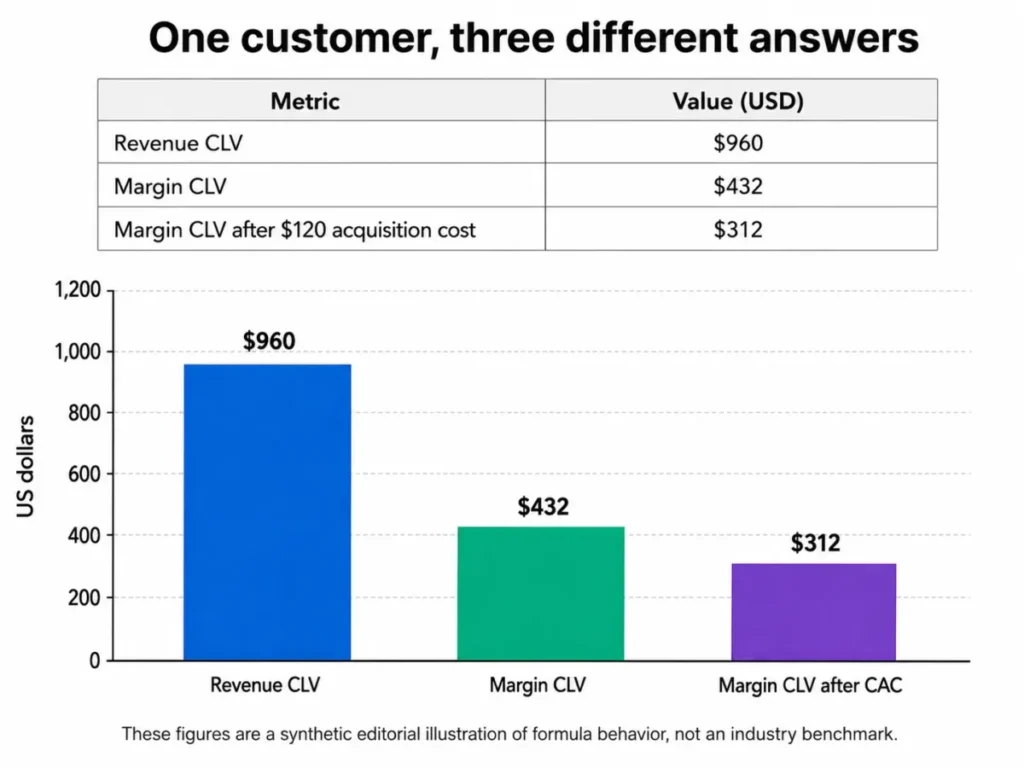
Treat the revenue bar as a ceiling and the third bar as the only number worth putting in a budget conversation.
Intermediate Template: Worked SaaS LTV Example
Subscription businesses swap order behavior for recurring revenue and churn. The same discipline applies, and the churn field is where it usually breaks.
| Input | Value |
|---|---|
| ARPA | $120 per month |
| Gross margin | 80% |
| Revenue churn rate | 4% per month |
| Customer acquisition cost | $600 |
- Formula source: subscription CLV built from ARPA, gross margin, and revenue churn, checked 2026-08-09.
Applying the documented subscription variant: 120 × 0.80 ÷ 0.04 = 2,400. At 1% monthly churn the same inputs produce $9,600, so a churn field you cannot evidence is not a small error.
The implied lifetime sitting inside that denominator is 25 months, because HubSpot’s estimate of one divided by the churn rate resolves to 25 at a 4% monthly rate.
That output is a margin figure already, so comparing it to a $600 acquisition cost is legitimate and gives 4 to 1. Do not read 4 to 1 as universally healthy, because the same ratio means different things at different margin, payback, and cash-flow positions.
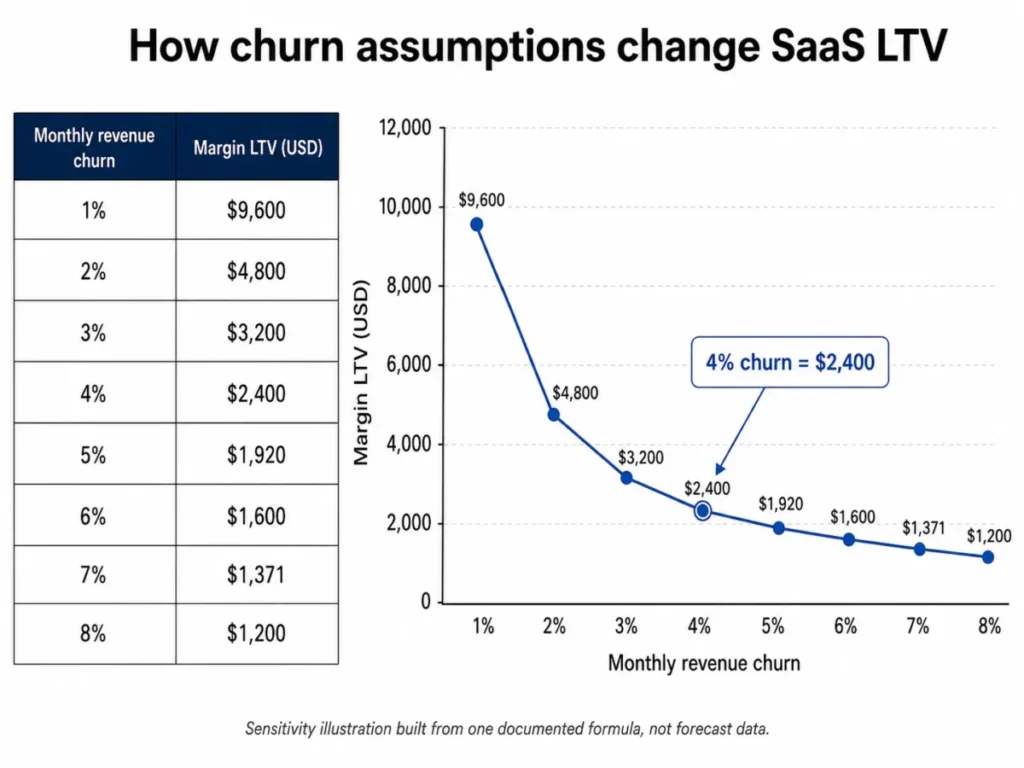
The curve is the argument against precision, and it is why the sensitivity worksheet below exists.
Advanced Template: Sensitivity, Cohorts, and Discounted Cash Flow
A single point estimate implies a confidence the inputs do not carry. Vary one uncertain assumption at a time and publish the range instead.
| Scenario | Changed assumption | Margin LTV in US dollars |
|---|---|---|
| Low | Revenue churn 6% per month | 1,600 |
| Base | Revenue churn 4% per month | 2,400 |
| High | Revenue churn 3% per month | 3,200 |
- Scenario formula: the documented ARPA, gross margin, and revenue churn variant, checked 2026-08-09.
Every row above holds ARPA at $120 and gross margin at 80%, changing only churn. Publishing a range is the honest response to Shopify’s warning that a flat historical model does not account for shifts in customer behavior or market volatility.
Label these as editorial scenarios rather than forecasts, and repeat the exercise on whichever input scored lowest in Step 5.
Segment comparison is the follow-up that turns a metric into a budget decision. Twilio recommends calculating CLV by plan, acquisition channel, geography, and customer type instead of relying on one company-wide average.
- Segmentation source: Twilio on calculating CLV for different segments, checked 2026-08-09.
| Segment | Customers | Revenue CLV | Margin CLV | CAC | Margin CLV after CAC | Notes |
|---|---|---|---|---|---|---|
| Paid search | Record the attribution window used | |||||
| Organic and content | Usually longer lifespan, slower ramp | |||||
| Paid social | Watch for fast churn on discount-led cohorts | |||||
| Referral | Keep referral value out of the base CLV | |||||
| First-purchase month cohort | One row per cohort month | |||||
| Product tier or plan level | Compare on the same margin basis |
Mailchimp describes cohort-based CLV as grouping customers by shared characteristics such as when they made their first purchase or which channel they came from, then tracking their value over time, which is what the worksheet above operationalizes.
For the discounted cash flow model, keep the discount rate blank until finance supplies one.
- Model source: Twilio’s discounted cash flow CLV equation, checked 2026-08-09.
That variant sums per-period contribution divided by one plus the discount rate raised to the period, then subtracts acquisition cost. The rate you pick changes a ten-year result far more than a small margin revision does.
Referral and network value stays on its own line. Adding it into the base metric makes a customer look more valuable than their direct economics support, and it removes your ability to audit the number later.
Free Customer Lifetime Value Spreadsheet Template
Rebuild this in Excel or Google Sheets with four tabs. The layout is deliberately boring so that next quarter’s calculation is comparable to this one.
Tab 1, Inputs. Column A holds field names, column B holds values, column C holds the source system, and column D holds the period the value came from. Fields: calculation date, data start date, data end date, currency, customer definition, segment, average purchase value, purchase frequency, customer lifespan, ARPA, churn rate, churn basis, gross margin percent, acquisition cost, cost to serve.
Tab 2, Results. Revenue CLV in B2 as =Inputs!B7*Inputs!B8*Inputs!B9, and margin CLV in B3 as =Results!B2*Inputs!B13. Subscription margin LTV goes in B4 as =(Inputs!B10*Inputs!B13)/Inputs!B11, value after CAC in B5 as =Results!B3-Inputs!B14, and a text cell holds the model used. Add a guard on the subscription cell so a zero churn entry returns a warning rather than a division error.
Tab 3, Segments. One row per segment using the seven columns from the worksheet above, with revenue CLV and margin CLV referencing the same formulas as Tab 2.
Tab 4, Assumptions. Calculation date, cohort or segment, customer definition, source period, currency, churn basis, margin definition, revenue basis for refunds and discounts, and free-text notes on anything you excluded.
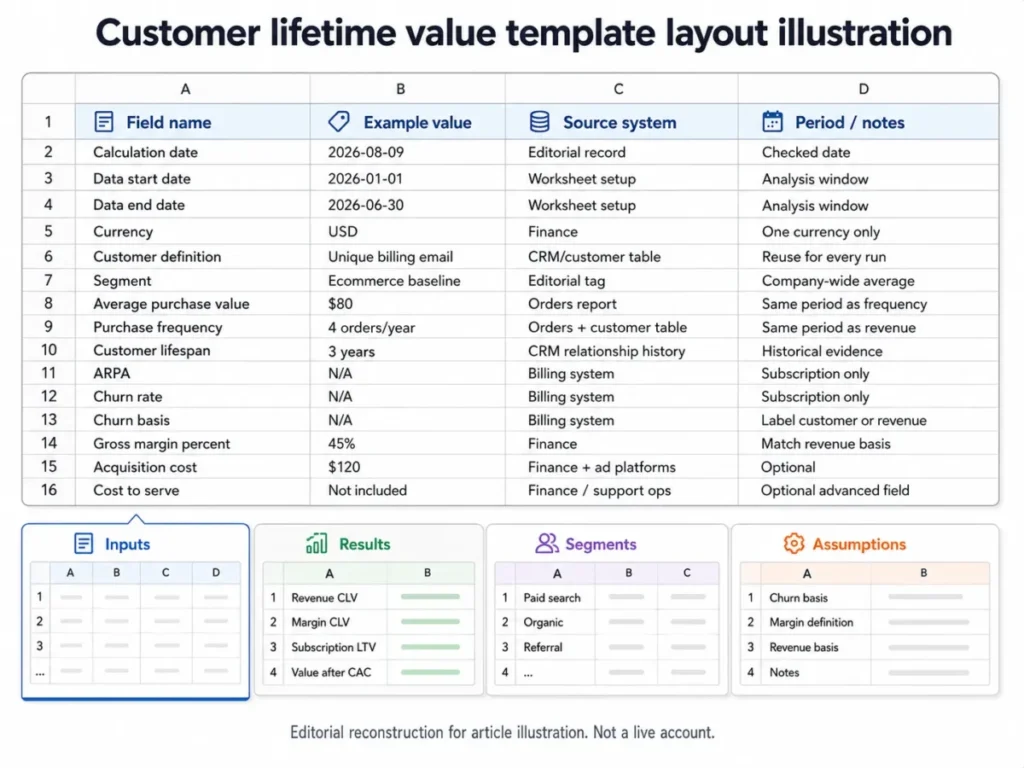
The Assumptions tab is the tab people delete and then regret. Without it, a CLV recalculated six months later is a different number rather than a trend.
Prefer to start from a sheet that already holds customer records? The CRM Excel template and the Google Sheets CRM template both give you a customer table to join to an orders export.
How to Interpret LTV to CAC Without a Universal Threshold
Publish the ratio as a number and let the context do the judging. A ratio built on margin CLV and a fully loaded acquisition cost is a different animal from one built on revenue and media spend alone.
Five things change what an acceptable ratio looks like: gross margin, payback period, how reliable your retention evidence is, how much capital you can put at risk, and whether the operating model needs cash back quickly. A capital-constrained business with a fourteen-month payback can be in trouble at the same ratio that suits a business recovering CAC in four months.
If gross margin is missing, report the ratio as a revenue ratio and say so on the sheet. Treating a revenue ratio as a profitability signal is the most common way a healthy looking chart hides a losing channel.
Red Flags in a CLV Number
Pause the analysis if you see any of these.
- Lifespan chosen to make the model work. A lifespan with no relationship history behind it is an assumption wearing a data costume.
- Churn field with no basis label. Customer churn and revenue churn produce different results from the same formula.
- Churn near zero. The denominator collapses and the output stops being usable.
- Revenue result described as profit. Check the label before the number moves any budget.
- Mixed time units. Monthly and annual inputs in the same run.
- Margin above 100%. The revenue and margin bases disagree.
- A blended average used to defend one channel. Segment first, then defend.
- Referral value folded into base CLV. The base metric stops being auditable.
- A discount rate that arrived as a default. Somebody else’s cost of capital is not evidence.
- Analytics lifetime revenue pasted in as CLV. Different population, different window, different question.
- No calculation date on the sheet. You cannot compare it to anything later.
- Refunds in revenue but not in margin. The two halves of the calculation disagree.
Common Errors in a CLV Tool Workflow
- Treating one company average as the answer. Mailchimp names incorrect customer segmentation as a common CLV mistake, and a blended figure is the most expensive version of that error. Fix it by running the segment worksheet before any budget conversation.
- Choosing an unrealistic customer lifetime. The same list flags this directly. Fix it by deriving lifespan from churn and labelling it as derived.
- Letting assumptions go stale. Prices, margins, and behavior move. Fix it by recalculating whenever churn, margin, or acquisition cost changes materially, not on a fixed calendar.
- Comparing revenue CLV to CAC. Fix it by applying margin before the ratio, and by suppressing profitability language when margin is missing.
- Counting retention twice. Fix it by keeping each formula self-contained.
- Ignoring cost to serve on large accounts. A high-revenue account with heavy support demand can be worth less than a quiet mid-market one. Fix it by adding a cost-to-serve line on the advanced sheet.
- Reading a historical baseline as a forecast. Fix it by naming the model on the results tab.
When Not to Use the Simple CLV Formula
The basic model earns its place through speed, not accuracy. Shopify notes the basic customer lifetime model is ideal for businesses with stable, predictable sales, which is a narrower endorsement than most calculator pages imply.
Skip it, or downgrade how much weight you give it, in these situations:
- Purchase behavior is changing materially year over year.
- Cohorts differ enough that one average describes nobody.
- Expansion and contraction revenue are significant parts of the account.
- The horizon is long enough that the time value of money matters.
- Churn is zero, unstable, or measured on an unlabelled basis.
- Fulfillment, onboarding, or support costs are material and unmeasured.
- The decision needs a forecast rather than a baseline, in which case a predictive or cohort model is the right tool.
What to Do After You Calculate CLV
Match the next step to the outcome, not to the number’s size.
If margin CLV comfortably exceeds fully loaded CAC: raise the acquisition ceiling on the specific segments that earned it, and re-run monthly while spend scales.
If the ratio is thin: work the retention side first, since lifespan is the input with the most influence in every formula on this page. Scoring inbound demand properly helps here, and lead scoring explained covers how to stop paying to acquire customers who never reach a second purchase.
If one channel drags the blended average down: cut or rebuild that channel before touching the others, and map where the drop-off starts against your lead management process.
If your inputs failed the Step 5 scoring: fix instrumentation before strategy. For ecommerce teams, the systems compared in the best CRM for ecommerce stores roundup are where the customer and order tables usually need to be joined.
If the inputs are right but the workflow is not: a satisfaction or engagement measure catches churn risk earlier than revenue does, and the CRM implementation guide covers the rollout work that keeps the underlying data clean.
Methodology and Sources
The formulas, model families, and documented limitations on this page come from official product documentation published by the companies that operate the relevant analytics, billing, ecommerce, and CRM systems.
Selection criteria were narrow. A formula earned a place only when an official source documented it, and each model is presented with the output label that source supports.
Both worked examples use invented input values chosen to show formula behavior. They are editorial illustrations of arithmetic, reproducible from the inputs shown.
Three things are deliberately absent because no opened official source establishes them for every business: a universal good CLV figure, a universally healthy LTV to CAC ratio, and a default rate for discounting future cash flows.
Source: official product documentation from Shopify, HubSpot, Salesforce, Mailchimp, Google Analytics, and Twilio. Checked: 2026-08-09.
Frequently Asked Questions
How do you calculate customer lifetime value?
Multiply average purchase value by purchase frequency, then multiply by average customer lifespan. That gives revenue CLV.
Multiply the result by gross margin to get margin CLV, which is the figure to use when the decision involves acquisition spending.
What is the formula for customer lifetime value in a SaaS business?
Divide ARPA multiplied by gross margin percentage by the revenue churn rate for the same period. A $120 monthly ARPA at 80% margin and 4% monthly revenue churn gives 120 × 0.80 ÷ 0.04, or $2,400.
Should customer lifetime value use revenue or profit?
Both, labelled separately. Revenue CLV sizes the relationship, margin CLV sizes what you can spend, and only the margin figure belongs in an acquisition ratio.
How do you calculate average customer lifespan if you do not have years of history?
Divide one by your churn rate for the period. At 4% monthly churn that implies 25 months, and you should record it on the sheet as a derived value rather than an observed one.
Should I use customer churn or revenue churn in an LTV calculator?
Use the one the formula was written for and label the field. The subscription formula on this page is the revenue churn form, so entering customer churn into it silently answers a different question.
Why is my customer lifetime value unrealistically high?
Check the churn denominator first, then the time units. Churn near zero, or a monthly churn rate paired with annual revenue, produces large numbers with no arithmetic error visible anywhere.
What is a good customer lifetime value?
There is no universal figure, and any calculator that publishes one is guessing on your behalf. A useful result is one that exceeds your fully loaded acquisition cost on a margin basis, with a payback period your cash position can carry.
Is GA4 lifetime revenue the same as CLV?
No. GA4 User lifetime reports observed lifetime revenue and behavior for users in its own population and window, while a CLV calculator extrapolates or forecasts from inputs you supply, so the two answer different questions and rarely match.
How often should CLV be recalculated?
Recalculate when an input moves, not on a fixed schedule. A material change in churn, margin, acquisition cost, or product mix is the trigger, and the Assumptions tab is what makes the comparison meaningful.
Can customer lifetime value be negative?
Yes, once costs are included. A cost-aware calculation that subtracts total costs to serve, or margin CLV minus acquisition cost, can land below zero for a segment that churns before it repays what you spent to win it.