
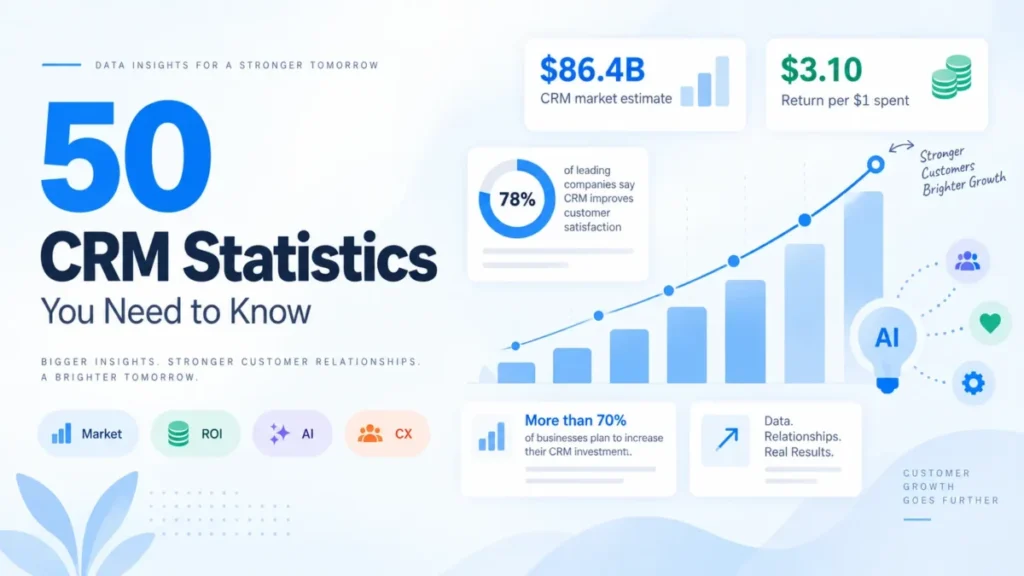
The most quoted CRM statistic on the web says a CRM returns 8.71 dollars for every dollar spent. That figure could not be traced to a current primary source during this check, while the benchmark that can be traced sits at 3.10 dollars.
This page collects 50 CRM statistics that were opened at the publisher that published them and quoted on 2026-09-06. Every figure carries its publisher and, where the publisher states one, the year it measures, and market figures add a label saying whether the value is observed, projected, or forecast.
Quick answer: The global CRM market was worth 79.6 billion dollars in 2025 and is projected at 86.4 billion dollars in 2026 by Grand View Research. Gartner reports a separately defined CRM software market at 128 billion dollars for 2024. The defensible CRM return benchmark is 3.10 dollars for every dollar spent, not 8.71.
In This Article (18 sections)
What Counts as a CRM Statistic Here
A number about salespeople is not automatically a number about CRM. Most roundups blur that line, which is how a survey of sales professionals ends up quoted as a CRM adoption rate.
Four buckets separate the 50 statistics below, and each section of this page sits in exactly one of them.
| Bucket | What it measures | What it cannot be used for |
|---|---|---|
| CRM market | Revenue, growth and structure of the software market | Counting how many companies own a CRM |
| CRM economics | Return, cost recovery and the composition of that return | Predicting a single company’s outcome |
| CRM-enabled operations | Sales, AI and data work that runs through or beside a CRM | Proving a CRM product caused the result |
| CRM-linked experience | Customer expectations that set service CRM requirements | Claiming any vendor already meets them |
Market size is not adoption, and a sales-AI figure is not a CRM-AI figure. A customer-expectation survey describes what buyers want, not what a platform delivers.
CRM Market Size and Growth Statistics
Two respected publishers report CRM market values that are not comparable, and both are correct on their own terms.
Grand View Research reports a projection for the 2026 market. Gartner reports an observed total for the 2024 market on its own definition, and neither page reproduces the other’s segmentation.
Reading them as a contradiction, averaging them, or subtracting one from the other produces a number that belongs to neither.
| # | Statistic | Value | Evidence |
|---|---|---|---|
| 1 | Global CRM market value, 2025 | 79.6 billion dollars | Grand View Research, 2025, observed |
| 2 | Global CRM market projection, 2026 | 86.4 billion dollars | Grand View Research, 2026, projected |
| 3 | Global CRM market forecast, 2033 | 161.3 billion dollars | Grand View Research, 2033, forecast |
| 4 | CRM market growth rate, 2026 to 2033 | 9.3 percent compound annual growth | Grand View Research, forecast |
| 5 | CRM software market value, 2024 | 128 billion dollars | Gartner, 2024, observed |
| 6 | CRM software market growth, 2024 | 13.4 percent in current dollar terms | Gartner, 2024, observed |
| 7 | Cross-CRM segment growth, 2024 | 17.7 percent | Gartner, 2024, observed |
| 8 | Customer data platform growth, 2024 | 21.9 percent | Gartner, 2024, observed |
Source: Grand View Research, Customer Relationship Management Market Report; Gartner, worldwide CRM market share for 2024.
Source: Gartner, growth in customer experience and relationship management software.
The cross-CRM and customer data platform numbers are the interesting pair here. Both grew faster than the CRM market as a whole in 2024, and Gartner attributes that to the role of rich customer profiles in supporting AI.
That matters before any AI purchase. Gartner’s own note on the 2024 results says the rise of AI had not yet materially affected growth rates.
CRM Market Structure Statistics
Market structure answers a different question from market size: where the money sits, not how much of it there is. Four of the six figures below are shares of a market total, and none of them is a count of companies.
| # | Statistic | Value | Evidence |
|---|---|---|---|
| 9 | North America share of CRM revenue, 2025 | 40.4 percent | Grand View Research, 2025, observed |
| 10 | Customer service share of CRM market revenue, 2025 | 22.5 percent | Grand View Research, 2025, observed |
| 11 | Cloud deployment share of the CRM market, 2025 | 59.4 percent | Grand View Research, 2025, observed |
| 12 | Large enterprise share of CRM revenue, 2025 | 59.2 percent | Grand View Research, 2025, observed |
| 13 | Asia Pacific growth rate | 16.3 percent compound annual growth | Grand View Research, forecast, period not stated on the page |
| 14 | Social media monitoring segment growth | 17.2 percent compound annual growth | Grand View Research, forecast, period not stated on the page |
Source: Grand View Research, CRM market segmentation by region, solution and enterprise size.
Statistic 12 is the one most often misread. A 59.2 percent revenue share for large enterprises does not mean 59.2 percent of large enterprises run a CRM, and it says nothing about how many small businesses have one.
Statistic 10 corrects a second habit. Customer service, not sales, is the largest CRM segment in this taxonomy, so a CRM roundup written entirely around pipelines is describing a minority of the market.
CRM Software Segment Forecasts
Functional submarkets track buying decisions better than one global total. A sales leader and a marketing leader are not shopping in the same market, and Gartner forecasts them separately.
| # | Statistic | Value | Evidence |
|---|---|---|---|
| 15 | CRM sales software market, 2025 | 28.7 billion dollars | Gartner, 2025, forecast |
| 16 | CRM sales software growth through 2029 | 12.8 percent compound annual growth | Gartner, forecast |
| 17 | CRM marketing software market, 2024 | 29 billion dollars | Gartner, 2024 forecast base year |
| 18 | CRM marketing software forecast, 2029 | 55 billion dollars | Gartner, 2029, forecast |
| 19 | CRM marketing software growth, 2024 to 2029 | 13.4 percent compound annual growth | Gartner, forecast |
| 20 | Agentic AI CRM spending forecast, 2029 | 216 billion dollars | Gartner, 2029, forecast |
| 21 | Year agentic AI CRM spending overtakes non-agentic | 2028 | Gartner, forecast |
Source: Gartner, CRM sales software forecast; Gartner, CRM marketing and cross-CRM forecast.
Source: Gartner, agentic AI in CRM software forecast.
Statistics 20 and 21 are the most useful planning numbers on this page, and the most frequently stripped of their qualifiers. Both are forecasts, and the crossover year is 2028, which is two budget cycles away rather than a description of the present.
A roadmap built on statistic 21 has a date attached to it. A roadmap built on the phrase “AI is transforming CRM” does not.
CRM ROI Statistics
The ROI section is where CRM research decays fastest. Several pages published in 2026 still lead with 8.71 dollars returned for every dollar spent, a figure this check could not trace to any current primary source.
| # | Statistic | Value | Evidence |
|---|---|---|---|
| 22 | CRM return per dollar spent | 3.10 dollars | Nucleus Research, measurement year not stated |
| 23 | Decline in CRM return over ten years | 37 percent | Nucleus Research, ten-year comparison, years not stated |
| 24 | Earlier comparison point in that series | 4.90 dollars per dollar spent | Nucleus Research, prior benchmark, year not stated |
| 25 | Share of total ROI from productivity and process efficiency | 51 percent | Nucleus Research, benefit-area finding |
Source: Nucleus Research, CRM return per dollar spent; Nucleus Research, CRM benefit areas with the greatest ROI impact.
Statistic 25 changes what a CRM business case should promise. Time savings and process efficiency carry 51 percent of the measured return, while Nucleus reports that increased revenue contributed least of the benefit areas it examined.
A finance approval built on a revenue-lift promise therefore rests on the smallest measured contributor. A case built on recovered hours rests on the largest one.
CRM Vendor Share and AI Adoption Statistics
Vendor share and AI adoption come from different kinds of evidence, and both need their attribution kept intact. Statistic 26 reaches the public through a vendor page that reports an analyst result, so the analyst stays named.
| # | Statistic | Value | Evidence |
|---|---|---|---|
| 26 | Salesforce share of the CRM market, 2025 | 20.0 percent | IDC, reported by Salesforce, 2025, observed |
| 27 | Sales organizations using some form of AI | 87 percent | Salesforce State of Sales, fielded 2025 |
| 28 | Sellers who say they have used agents | 54 percent | Salesforce State of Sales, fielded 2025 |
| 29 | Sellers planning to use agents by 2027 | Nearly 9 in 10 | Salesforce State of Sales, fielded 2025, stated intent |
| 30 | Sales leaders with agents calling them essential for meeting business demands | 94 percent | Salesforce, 2026 report |
| 31 | Reps with agents saying agents improve their odds of hitting targets | 88 percent | Salesforce, 2026 report |
| 32 | High performers against underperformers | 1.7 times more likely to use prospecting agents | Salesforce, 2026 report |
Source: Salesforce, IDC CRM market share ranking; Salesforce, State of Sales survey of sales professionals.
Source: Salesforce, sales statistics for 2026.
Statistics 27 to 29 rest on a double-anonymous survey of 4,050 sales professionals fielded between August and September 2025, which is one of the few sample sizes disclosed anywhere in this dataset.
Statistic 29 is stated intent, not deployment, and the two are routinely merged into one sentence. A planning figure near nine in ten and a usage figure of 54 percent describe a gap that has to close through real projects.
Statistic 32 is a correlation reported by a vendor survey. High performers use prospecting agents more often than underperformers, which does not establish that the agents produced the performance.
CRM Data Readiness Statistics
Seven figures on the same Salesforce page describe the data conditions leaders report around AI work, and they read as a sequence rather than a list. Each one names a condition that has to be true before an agent can act on customer data.
| # | Statistic | Value | Evidence |
|---|---|---|---|
| 33 | Data and analytics leaders agreeing AI outputs are only as good as its data inputs | 84 percent | Salesforce, 2026 report |
| 34 | Leaders saying the most valuable insights are trapped in unstructured data | 70 percent | Salesforce, 2026 report |
| 35 | Leaders saying unified data is key to meeting customer expectations | 87 percent | Salesforce, 2026 report |
| 36 | Company data sales leaders estimate is inaccessible | 19 percent | Salesforce, 2026 report, respondent estimate |
| 37 | Sales professionals saying data security concerns halt AI initiatives | 51 percent | Salesforce, 2026 report |
| 38 | Sales leaders with AI saying technology silos delay or limit AI work | 51 percent | Salesforce, 2026 report |
| 39 | Sales teams with AI prioritizing data hygiene | 74 percent | Salesforce, 2026 report |
Source: Salesforce, sales and data statistics reported for 2026.
51% halted
The order is what makes these usable. Statistic 33 is a general proposition 84 percent of those leaders agree with, and statistic 36 is what sales leaders estimate about reach, so the two together describe a reported constraint rather than a measured one.
Statistic 39 is the one to imitate. Three quarters of the teams already running AI are spending effort on data hygiene, which is a maintenance commitment rather than a purchase.
Sales Productivity and Tool Sprawl Statistics
Adding tools is the reflex response to a slow pipeline, and this group of statistics argues against it. Five figures describe the conditions around a seller’s week before any new software arrives.
| # | Statistic | Value | Evidence |
|---|---|---|---|
| 40 | Sales professionals saying the sales cycle is getting longer | 57 percent | Salesforce, 2026 report |
| 41 | Rep time spent on non-selling tasks | 60 percent | Salesforce, 2026 report |
| 42 | Average tools a seller uses to close deals | 8 | Salesforce, 2026 report |
| 43 | Reps who feel overwhelmed by too many tools | 42 percent | Salesforce, 2026 report |
| 44 | Quota attainment gap among overwhelmed sellers | 45 percent less likely to attain quota | Salesforce, 2026 report |
Source: Salesforce, sales productivity and tool statistics.
Statistics 43 and 44 sit next to each other on the same Salesforce page and describe an association, not a proven cause. Overwhelmed sellers attain quota less often, and nothing on that page establishes which condition came first.
The consolidation case still stands on statistic 41. When 60 percent of a rep’s time already goes to non-selling work, a ninth tool has to remove more administration than it adds.
CRM Effectiveness, Buyer Behavior and Automation Statistics
Three figures connect the CRM record to what actually happens in a deal. They come from HubSpot research and describe perception and behaviour rather than platform capability.
| # | Statistic | Value | Evidence |
|---|---|---|---|
| 45 | Salespeople rating their CRM effective at sales and marketing alignment | 78 percent | HubSpot, credited to 2025 |
| 46 | Prospects who report researching before speaking with a human sales rep | 96 percent | HubSpot State of Sales Report, credited to 2025 |
| 47 | Salespeople using AI who automate note-taking, scheduling and CRM updates | 32 percent | HubSpot, 2026 Sales Trends Report |
Source: HubSpot, 2026 marketing statistics; HubSpot, sales trends data on AI automation.
Statistic 45 is a perception measure. Salespeople report that the CRM helps alignment, which is different from a controlled result showing that alignment improved.
Statistic 46 changes what a seller needs from the record. When almost every prospect reports researching first, the useful CRM field is the one holding context the buyer could not have found alone.
Statistic 47 is the practical face of CRM AI in 2026. It counts salespeople already using AI, and note-taking, scheduling and CRM updates are one combined category in that research, so it cannot be split into three separate adoption rates.
Service CRM and Customer Experience Statistics
Service expectations set requirements that a sales-first CRM evaluation never surfaces. These three figures come from the Zendesk CX Trends 2026 research and describe consumers, not platforms.
| # | Statistic | Value | Evidence |
|---|---|---|---|
| 48 | Consumers expecting 24/7 service because of AI | 74 percent | Zendesk CX Trends 2026 |
| 49 | Consumers saying responsiveness and accurate resolution strongly influence purchases | 86 percent | Zendesk CX Trends 2026 |
| 50 | Consumers expecting an explanation for AI-made decisions | 95 percent | Zendesk CX Trends 2026 |
Source: Zendesk, CX Trends 2026 consumer findings.
Statistic 50 is a governance requirement dressed as a preference. An automated decision that arrives with no explanation at all fails an expectation held by 95 percent of consumers, whatever the regulation says.
None of these three proves that any CRM meets the expectation. They describe the bar a service configuration has to clear.
The STAMP Check for Any CRM Statistic
Every number on this page was run through five checks before it was published, and the same five will catch most bad CRM statistics found elsewhere. The check is deliberately short enough to run on a figure someone pastes into a deck.
| Letter | Question | Failure it catches |
|---|---|---|
| S | Which source published it, and is it the original? | A roundup citing a roundup |
| T | What year does it measure, and when was it checked? | A 2014 figure presented as current |
| A | Who was asked, in which market, and how many? | A vendor survey read as a census |
| M | Which market or population does it define? | Two publishers averaged into one number |
| P | Is it an actual, an estimate, or a forecast? | A 2029 projection quoted as achieved |
A missing dimension is reported, never filled in by inference. Only one source in this set discloses a sample, the Salesforce State of Sales survey of 4,050 sales professionals, and several rows above carry an explicit note that the publisher did not state a period or a measurement year.
CRM Statistics That Are Outdated or Unverified
Two of the most repeated CRM numbers did not make this list, and the reason is the same in both cases. Neither could be traced to a current primary study during the source check.
Misconception: the average CRM returns 8.71 dollars per dollar spent. Reality: no current primary source for that figure was reached during this check. The traceable benchmark is 3.10 dollars, down 37 percent over ten years from 4.90 dollars, and 8.71 is not part of that published series.
Misconception: 91 percent of companies with ten or more employees use a CRM. Reality: no current primary study for that figure was reached during this check, so it is recorded here as an open gap rather than published as a statistic. A defensible 2026 company-level adoption rate was not available.
Misconception: a 2026 statistics page should only contain research fielded in 2026. Reality: the useful test is the most recent defensible evidence at the check date, with the measurement year shown. Several figures here measure 2024 or 2025 because that is when the underlying research was conducted.
Misconception: different publishers’ CRM market sizes can be averaged. Reality: Grand View Research and Gartner define the market differently and report different base years, so combining them produces a value neither publisher would defend.
Misconception: every AI sales statistic is a CRM AI statistic. Reality: statistics 27 to 32 describe AI use inside sales organisations. Some of that work runs in the CRM and some does not, and the research does not separate the two.
Which CRM Statistics Matter to Your Role
The 50 figures above answer different questions depending on who is reading them. This map points each role at the smallest set that changes a decision.
| Role | Statistics to use | Decision it informs |
|---|---|---|
| CFO or finance lead | 1 to 4, 22 to 25 | Whether the business case promises recovered time or revenue lift |
| Chief revenue officer | 40, 41, 44 | Whether pipeline pressure is a headcount problem or an administration problem |
| RevOps lead | 33 to 39, 42, 43, 45 | Which data and consolidation work has to happen before an AI purchase |
| Sales manager | 41, 42, 43, 47 | Which administrative task to automate first |
| Customer experience lead | 48, 49, 50 | Which service expectations the configuration has to meet |
| Analyst or journalist | 5 to 8, 15 to 21 | Which market definition and forecast horizon to cite |
A CFO reading statistic 25 asks a different approval question from one reading a revenue-lift promise. That single substitution is the highest-value change most CRM business cases can make.
How to Use These Statistics in a 2026 Decision
Use the market figures to set direction, not to size a budget. Statistics 1 to 8 describe a growing category, and none of them predicts what one company will spend.
Use the ROI figures to shape the business case. Statistic 22 gives a defensible expectation, and statistic 25 says which benefit area to build the case on.
Use the data readiness figures as a pre-purchase audit. Statistics 33 to 39 turn the readiness question into seven checkable conditions covering inputs, unstructured data, unification, access, security, silos and hygiene.
Avoid using any figure here as evidence that a specific product works. A market share, a survey result and a customer expectation are three kinds of context, and none of them is a product test.
When the question is which platform to buy, an evaluation of best CRM software does work that no statistic can do.
Avoid quoting a forecast without its year. Statistics 2, 3, 4, 13, 14, 15, 16, 18, 19, 20 and 21 are projections or forecasts, and each becomes a false claim the moment that label is dropped.
Give every cluster an owner before it enters a document. Finance owns the market and ROI figures because the budget input and the approved or rejected output both sit there, while RevOps owns the data readiness cluster whose workflow input is the CRM record itself.
The failure mode to watch is a figure quoted without its definition, which turns a measurement into a business impact claim its source never made. If a number cannot name its source and its measurement year, treat it as unverified rather than as evidence.
How These Statistics Were Selected and Checked
Selection ran on a fixed source hierarchy: independent market research first, then analyst research, then original vendor research that names its own study. Every source page was opened at the publisher that published it and quoted on 2026-09-06.
Each candidate figure was assessed against the same criteria: a named publisher, a stated measurement year, a defined population, an intact original attribution, and a clear separation between observed values and projections. Greater weight was given to figures that change a buying or benchmarking decision rather than figures that describe the category in general.
Vendor-published research stays attributed to the vendor that ran it, and analyst-reported results keep the analyst’s name even where a vendor page carries them, as statistic 26 does for IDC. Some publisher pages used here are that publisher’s own compilation of its own research, which is recorded in each row rather than presented as a primary study.
Forecasts are labelled as forecasts with their target year. Market values from different publishers are reported separately, because their definitions and base years are not interchangeable.
Related Resources
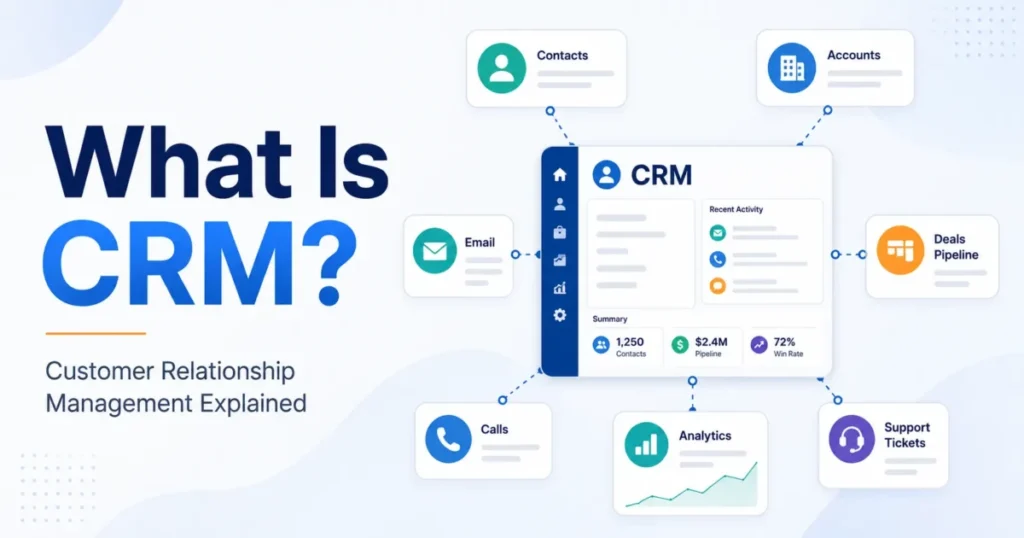
For the concept behind the numbers, start with what CRM software is and work forward from there.
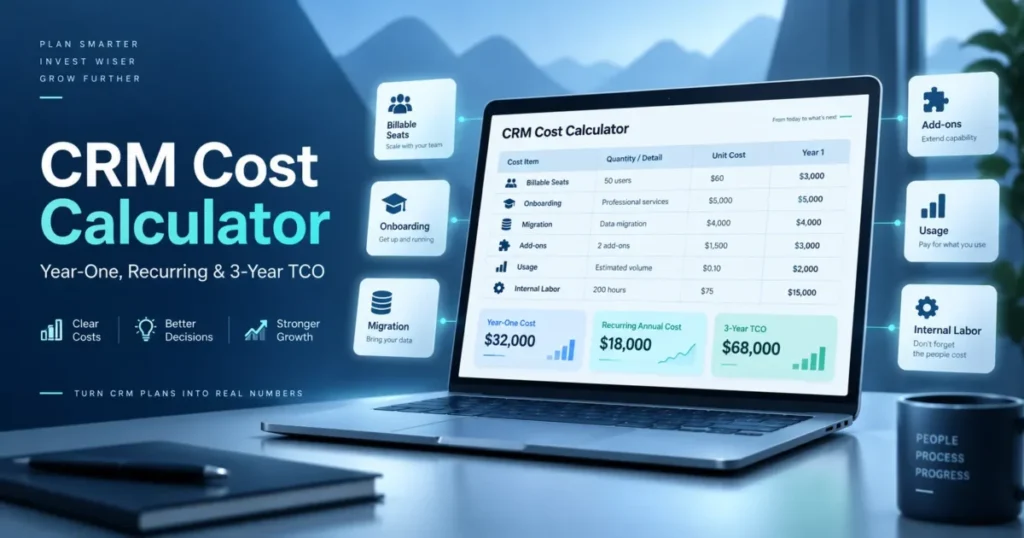
To turn statistic 25 into a figure for a specific team, the CRM cost calculator models the recovered-time side of the case.
Buyers narrowing a shortlist by team shape can compare CRM for sales teams against CRM for small business. Readers acting on statistics 27 to 39 can review AI CRM software with the readiness chain in hand.
The full selection and verification rules live in the site review methodology.
FAQ
A few questions come up repeatedly once the numbers above have been read.
What percentage of companies use CRM?
No defensible 2026 figure was reached during this check. The widely repeated 91 percent claim could not be traced to a current primary study, so it is reported here as an unresolved gap rather than a current statistic.
How big is the CRM market in 2026?
Grand View Research projects the global CRM market at 86.4 billion dollars in 2026. Gartner reported a separately defined CRM software market at 128 billion dollars for 2024, and the two figures use different base years and are not comparable.
What is the average ROI of CRM software?
Nucleus Research reports 3.10 dollars returned for every dollar spent. That is a 37 percent decline over ten years from an earlier comparison point of 4.90 dollars, and the widely circulated 8.71 figure is not part of that series.
What percentage of CRM is cloud based?
Cloud deployment held the largest CRM market share in 2025 at 59.4 percent according to Grand View Research. This is a market share, not the share of customers running a cloud deployment.
How is AI changing CRM in 2026?
Gartner forecasts that spending on CRM software with agentic AI capabilities overtakes spending without it in 2028 and reaches 216 billion dollars by 2029. On the buyer side, 54 percent of sellers say they have used agents and nearly nine in ten plan to by 2027.
How much time do sales reps spend on non-selling tasks?
Salesforce reports 60 percent of rep time goes to non-selling tasks. The same page puts the average seller on 8 tools, with 42 percent reporting they feel overwhelmed by the number.
What is Salesforce’s CRM market share?
Salesforce reports, citing IDC, a 20.0 percent share of the CRM market in 2025. The figure reaches the public through a Salesforce page reporting an IDC result, so the analyst attribution belongs with every quotation of it.
Which CRM statistics are outdated?
The 8.71 dollar ROI benchmark and the 91 percent company adoption rate are the two most commonly repeated figures that could not be traced to a current primary source during this check. Neither is published as a statistic on this page, and both are recorded as open gaps instead.
Your Next Step
Take the five or six statistics that match your role from the map above, and record the publisher and measurement year beside each one before it enters a deck. Run the STAMP check on anything a colleague adds to that list.
For a buying decision rather than a benchmarking one, cite the market direction and the ROI benchmark correctly, then move to a product evaluation where a statistic cannot substitute for evidence about the platform itself.